When to Sell My Investment Properties
Now I have already made the decision that I want to sell my investment properties before I do reach retirement. So far, my investment properties have been good to me in terms of providing a good return, however, when I do reach retirement, I do not want the potential for a significant cost to come out of the blue and take me by surprise.
However, I do always say that you need to be flexible with your FIRE journey, so there is always a possibility that some time into the future my mind my change and I may decide to keep my investment properties through retirement. But for the purposes of this post, I want to assume that I will be selling the properties and living my retirement with all my investments in shares/bonds.
My next step now was to look into which selling point optimised my financial return.
Setting Up A Spreadsheet
I decided the best course of action would be to build a spreadsheet which could help me with forecasting future returns based on designated inputs. By setting up these parameters I could set up multiple scenarios which could in turn tell me the optimised selling point.
In this POST, I did talk about how while your LVR is high, the benefits of capital growth are magnified, but over time, unless you regularly refinance, your LVR naturally decreases (as the price value increases of the property, and as you pay down the loan – if you have a principal and interest loan).
As with any sort of spreadsheet that forecasts financial returns into the future, there needs to be assumptions made based on returns. This can bring difficulty in accurately forecasting, as there is always the potential to be incorrect with the assumptions and changing the number could provide significantly different results. That is why I always like to carry out a sensitivity analysis on my assumptions at the end to see what sort of confidence I have in my numbers.
How The Spreadsheet Will Work
Based on the provided inputs, I want to simulate 20 different scenarios to forecast financial value over time within each scenario. The final result will be a total value after 10 years.
The first scenario will be assuming the property is sold immediately, the second scenario will assume the property is sold after 6 months, and so on, until the 20th scenario assumes the property is sold after 120 months.
I have two investment properties so I want to create a spreadsheet for each of them, as they will have different inputs associated with the unique property. Fortunately, spreadsheets are handy in that I can just copy and paste the whole spreadsheet to another tab and just use different inputs.
Spreadsheet Inputs
These are the following inputs I used for each of my properties:
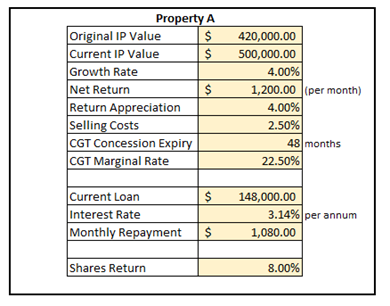
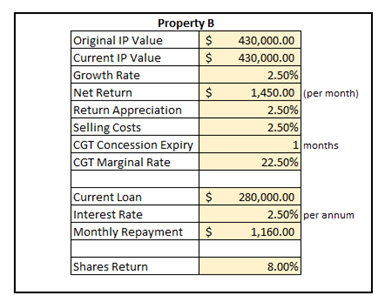
Just a quick summary of each input
Original IP Value – used to calculate capital gains tax (if applicable)
Current IP Value – used to calculate capital growth of the property from the start date.
Growth Rate – Property A should grow faster than Property B given its location.
Net Return – This is before mortgage repayments; these numbers are based on what I typically receive from each property.
Return Appreciation – Growth rate of the net return over time.
Selling Costs – selling costs associated with selling the property.
CGT Concession Expiry – Property A is still CGT Exempt for 4 years as it was my PPOR, Property B does not have any exemption.
CGT Marginal Rate – Tax rate to be expected for CGT, I have used 22.5% to account for 50% CGT Exemption at 45% Tax Rate.
Current Loan – Current loan still owing on each property.
Interest Rate – I have used my current interest rate, but obviously they could change over time.
Monthly Repayment – This is based on my current repayments.
Shares Return – Assumed return on investment per annum if invested in shares.
Results – Property A
It is time now to look at the results for each simulation and how they can tell me the optimised selling point.
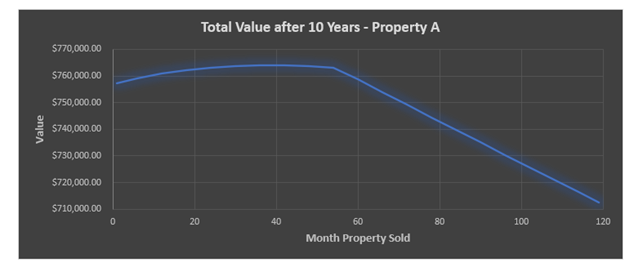
Above is the graph for Property A based on the inputs. You can see that after the 48-month mark (when CGT starts to kick in) it starts to significantly reduce the effectiveness of keeping the property, financially speaking.
So, what does this graph actually tell you? Looking at it briefly, you might think it tells you value over time, and that after around the 38-month mark, the value actually starts to go down, so that could be confusing?
Well, the graph is not telling you value over time, but rather it is telling you the value after 10 years, for each of the 20 simulations carried out previously. The X-Axis is when, within the 10-year period, the property was sold. If the property was sold immediately and the money invested into the share market, then after 10 years it could be expected to reach around $757,000 in value. If the property was sold after 20 months, then it could be expected to reach around $763,000 in value.
According to the spreadsheet, the optimised selling time is at the 36-month mark, where the total return is around $764,000. However, it is important to note, that as long as the property is sold prior to CGT kicking in, there is not too much of a difference in overall return. (around $7,000 give or take).
Results – Property B
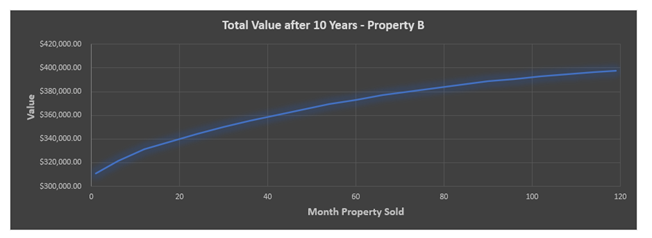
Property B is not quite as black and white as Property A unfortunately, as it appears the value of keeping the property increases well into the time of me wanting to retire (which will be around the 80-month mark hopefully).
I am lucky that at least it does appear to be reaching a peak and the potential for missed out financial gains is somewhat minimised. The return after 72 months is $380,000, and the return after 120 months is $397,000. So of course, $17,000 is not insignificant, but it is an amount I would be willing to accept given the minimised hassle of not having property ownership in my retirement.
For Property B, I will say the optimised selling time is at the 120-month mark.
Sensitivity Analysis
Now I want to check how impactful my inputs are for each property to provide for me the optimised selling time. I am not concerned with the overall return after 10 years, because that is not what I am trying to get out of this spreadsheet, all I want to know is what time is best for me to sell my property to optimise my return.
Property A
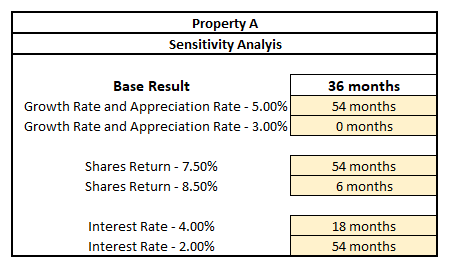
As you can see, relatively minor changes to the inputs can have some pretty significant impacts on the results. This is not ideal as it does not give me the greatest confidence in being able to achieve an optimised selling date.
Property B
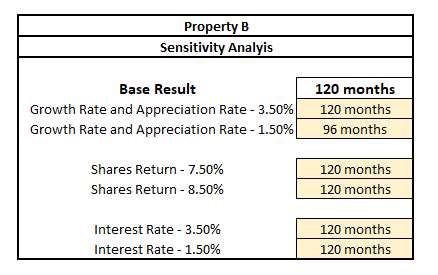
These results were a lot closer to the original case, although it may be deceptive given the spreadsheet did cut off at the 120-month mark. So, there is almost certainty that the actual optimised period may have changed significantly, just well past the 120-month mark.
Conclusion
I was surprised that were was such a discrepancy in the results between Property A and Property B, then I decided to have a think about what could actually be driving those results. What did Property B have that made it a much more appealing long-term prospect compared to shares (even with lower capital growth). Then I realised, I had already talked about it previously in this POST. It all goes back to the LVR.
The current loan amount in Property A is low because I keep my emergency fund and future retirement PPOR deposit in the Offset account. The LVR for Property A is only 29.6%.
The LVR for Property B, however, is currently at 65%. Therefore, even though the capital gains are expected to be lower, they are still magnified significantly to provide an overall decent return.
If I wanted to ensure Property A maintained significant returns, I would need to refinance and maximise leverage as much as possible to my advantage. This is not something I am prepared to do however as I do not want to increase my debt, and I also doubt the bank would let me as they would have a doubt if I could meet the serviceability requirements.
I was really happy to carry out this exercise, I knew I wanted to sell my properties some time before retirement, but it is useful to know that the time to sell can actually make a relatively significant difference in the overall returns.
So now I have a plan going forward –
Property A – Sell anytime before it loses CGT exemption.
Property B – sell just before reaching retirement.