Timing the Market vs Time In The Market
Introduction
Can you time the market? Can you predict the future, can you follow trends and make significant gains?
Most of us have heard the importance of time in the market compared to trying to time the market.
I was curious myself about this so I decided to see what it would actually look like. Basically I wanted to look at the price of an ETF over time, play around with a few different scenarios to see if it would be worth trying to time the market (with the benefit of hindsight) and find out what the results would look like.
I used the SPDR S&P 500 ETF Trust (SPY) which is on the NYSE. I used this one because it is a long running ETF that dates back to February 1993
Method
After adding through the historical price data (including dividends) I set up the following parameters:
- Purchase shares before a 2.00% drop in value (worst case scenario)
- Purchase shares before a 2.00% rise in value (best case scenario)
- Purchase shares after a 2.00% drop in value (at least this one would not require fortune telling)
- Purchase shares at the start of every month regardless of share value
In this example I have only looked at purchasing shares and accumulating them over time, I have not looked at buying and selling.
I was able to adjust the parameter for each scenario (for example, I could make it invest after a 3.00% drop in value) but for the purpose of this example I will keep them all at 2.00%
In my scenario I was able to save $100 per day (that the stock market was open) – so in each scenario $705,100 was invested
Results
The results you might find interesting, the final return value was as follows for each scenario:
- $705,100 turned into $3,046,564,38 – average return of 5.24% per annum
- $705,100 turned into $3,249,637.69 – average return of 5.47% per annum
- $705,100 turned into $3,126,417.00 – average return of 5.33% per annum
- $705,100 turned into $3,250,998.60 – average return of 5.47% per annum
Keep in mind this is not the true return of the ETF value over time. For reference the value of the ETF at the start and end date was as follows:
- Start Date – 01/02/1993 – Value $44.25
- End Date – 29/01/2021 – Value $370.07
This would represent an average return of 7.61% per annum, but remember the shares were not all bought up front, and bought over time.
I also did take into account brokerage fees ($9.50 per transaction) when calculating the total returns, as well as dividends. For interest the total number of transactions for each scenario was as follows:
- 298 transactions
- 235 transactions
- 297 transactions
- 335 transactions
So although purchasing monthly was carried out more often than other scenarios, the cost of each transaction was part of the final calculations, and overall, spending just under $3,200.00 on brokerage fees is quite insignificant when it only represents 0.1% of the total value of the portfolio.
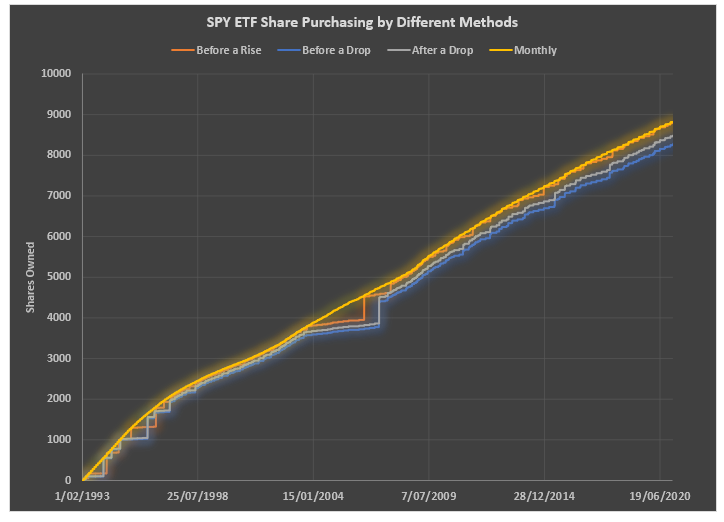
If you want to see a graph of purchasing of shares over the life of the ETF – there is a graph here
Conclusion
As you can see, even with the best case scenario, investing just before a big rise in the market, you still are NOT better off than just investing every month regardless of the price. This is definitely good news because at least you do not have to stress yourself out about trying to time the market.
If you want to see a graph of purchasing of shares over the life of the ETF – there is a graph here
Now obviously I have only looked at one ETF, and maybe it would be better to have a look at some others to see what sort of results they might show. But I think this at least shows some interesting data.
Also, I should clarify that my “best” case scenario only involved purchasing shares before a rise, if it was truly optimal, then best case scenario would also involve selling shares before a drop. But I thought for the purposes of what I was wanting to know I only looked at accumulating shares as oppose to selling shares as well.