Superannuation – Fee Comparison Part 2
In this previous POST I looked at the different fee structures of several of common Superannuation Funds that are currently available. In that post I looked at the total fees payable depending on your Superannuation balance.
In this post, I wanted to use those same fee structures and simulate a career and superannuation investment and compare the total fund value by the time you preservation age is reached.
One critical thing to note with this is that I will assume the same return from each Superfund for this exercise, this will obviously not be the case, but given performance is unknown, the best way to compare would be to assume the same return for each Superfund.
Methodology
I will assume the following contributions to be made throughout a working career and into an early retirement.
Age 18 to 22 – Monthly Contribution $800.00
Age 23 to 26 – Monthly Contribution $1,000.00
Age 27 to 30 – Monthly Contribution $1,200.00
Age 30 to 40 – Monthly Contribution $1,500.00
I have assumed contributions will stop at age 40, because this is for FIRE after all so for the purposes of this, we will have stopped working. Given the amount of contributions, I have also not maxed out the voluntary contribution to take advantage of beneficial tax circumstances.
Finally, obviously the contributions are just estimates, and they do not reflect specific circumstance, as they are just for comparison purposes.
I will assume an average return of 5.00% per annum (compounded monthly). This figure should take into account inflation over the 42-year period between starting work and reaching the preservation age of 60.
Superannuation Fees
The fees are only estimates, but currently I will be using the following fees for the various superfunds. It is also important to mention that within each Superfund there are several available products with different fees associated with each product. In this case I have assumed a 50/50 split between US and Australian shares.
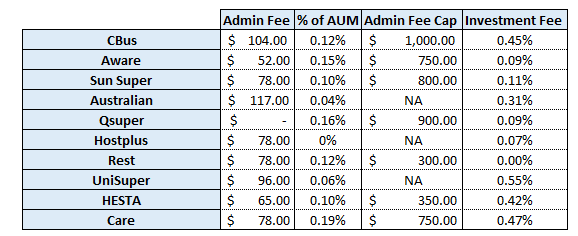
One important disclaimer to mention here is that I have assumed the same product to be used right up to preservation age. This would most likely not be the case as you might look to add some more defensive assets to your portfolio, but again this is just for comparison purposes, so I feel it is adequate.
Results
Below is a graph of the portfolio growth of each Superannuation fund up until preservation age is reached.
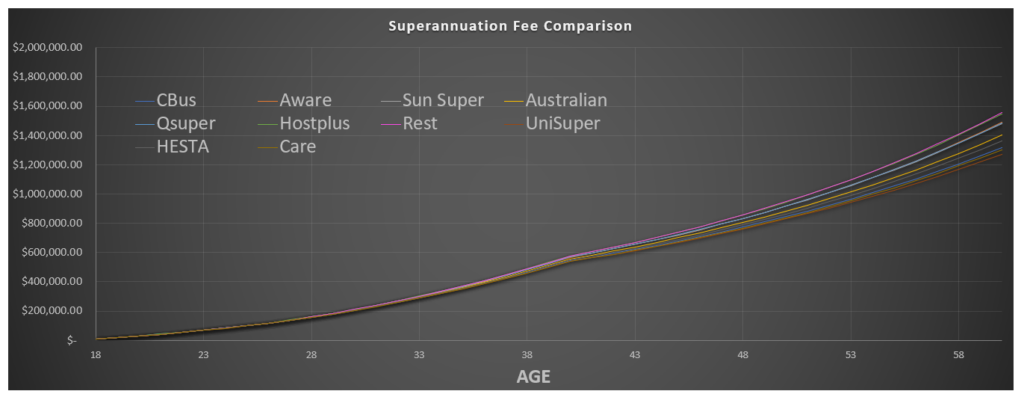
Unfortunately, the graph is quite difficult to make out but below is a table of the final portfolio amounts upon reaching preservation age
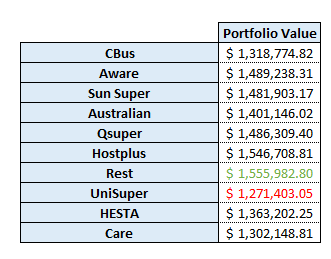
As you can see there is quite a significant difference between the best and worst performing portfolios, almost $300,000.00 difference just because of the different fee structure.
I believe the above graph and table really illustrate how important it is to look at reducing the fees you pay as part of your superannuation fund. However, I do need to stress this, it is not all about reducing fees, you could reduce your fees to almost 0.00% but it would mean your fund would be 100% allocated to cash, giving you zero chance of obtaining any sort of gain (unless there was negative inflation I guess). So, while you should endeavour to reduce your fees as much as possible, it is important to make sure you have a portfolio that is most suited to your situation.
Optimum Superannuation
In my last POST, I talked about an “Optimum Superannuation” where you could change your Superannuation provider depending on your account balance to take advantage of the lowest fees.
In summary, the following is the provider to choose depending on account balance:
$0.00 – $42,162.16 = QSuper
$42,162.16 – $461,538.46 = HostPlus
> $461,538.46 = Rest
If we now compare this “Optimum Superannuation” to our best performing Superannuation from earlier (Rest) we end up with the following graph:
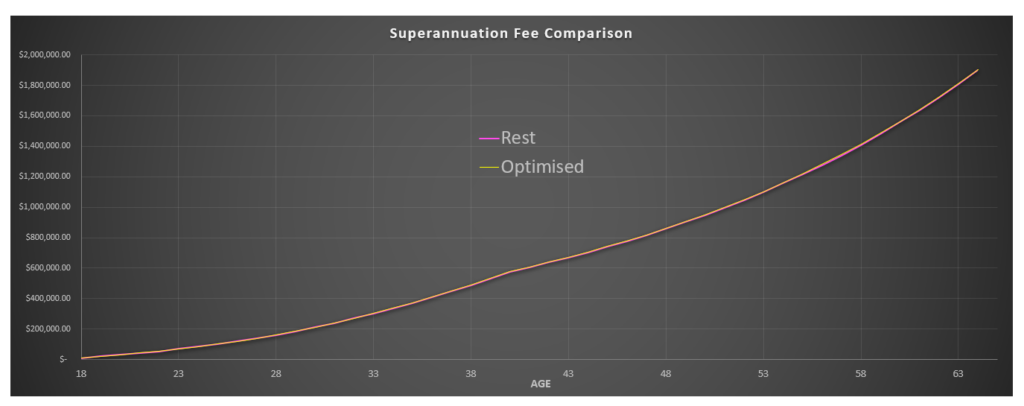
Looks like those lines really do marry up quite closely, looking at the final results at preservation age:
Rest Superannuation: $1,555,982.80
Optimised Superannuation: $1,561,270.99
The difference is just over $5,000.00, and considering the portfolio is worth around $1.55m it is quite insignificant. But if you did want to look at optimising your Superannuation as much as possible, then it is definitely a path you could pursue.
As I said in my previous post, I am currently with HostPlus, and once my portfolio does reach the $461,000 breakeven point between HostPlus and Rest, I will definitely consider moving across to Rest.
Conclusion
The purpose of this post is to illustrate how even relatively minor changes in the fee structures can have significant effects on overall portfolio value when we look at large periods of time and the power of compound interest.
It is important to keep in mind that all these superfunds are Industry Superfunds, there are also the retail superfunds which typically have significantly higher fee structures so you can imagine how much that would impact your overall return.
Lastly, I do want to just stress that the fees paid is not the most important factor, at the end of the day you want the best return possible. I would rather pay 2.00% fees on a fund that provides a 10.00% return, compared to paying 0.1% fees on a fund that provides a 6.00% return. That being said, performance is not a given and they are out of our control, fees are at least something we are able to manage.