Stock Selection – July 2021
Each month I will be hypothetically picking individual shares to invest with using a pre-determined criteria outlined in this POST.
Current Performance
Shares Owned
79 Units of RIO – Current Price: $130.60
646 Units of PDL – Current Price: $8.18
1515 Units of ARF – Current Price: $3.60
379 Units of SUL – Current Price: $12.82
101 Units of MIN – Current Price: $59.99
This gives us a total value of $31,973.45 and our initial investment was $29,862.52.
Baseline Comparison
246 Shares of A200 – Current Price: $124.00
This gives us a total value of $30,504.00 and our initial investment was $29,854.02.
Active Return: 7.07%
Passive Return: 2.18%
Currently our active share investment is ahead of passively investing in an Index based ETF. However, this is still a long-term investment and 2 months of results is not long enough to determine any significant results.
Checking Existing Holdings
Firstly, I want to check existing holdings to make sure they still meet the determined criteria:
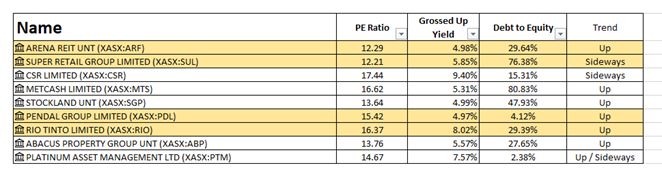
1st Criteria: PE Ratio between 11 and 22
2nd Criteria: Grossed Up Yield over 4.50%
3rd Criteria: Maximum Debt to Equity Ratio less than 100%
4th Criteria: 50-day SMA on a five-year chart showing the price not in a downtrend
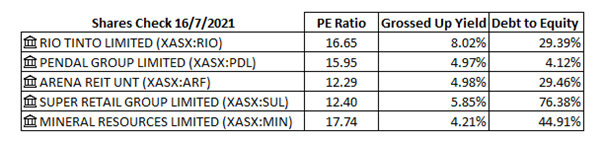
The table above provides a summary of the first three criteria. The only concern is the Grossed Up Yield for Mineral Resources, however I will still keep the listing as part of the portfolio for a little while and hope it improves in this area.
The results for the 4th Criteria are shown below:


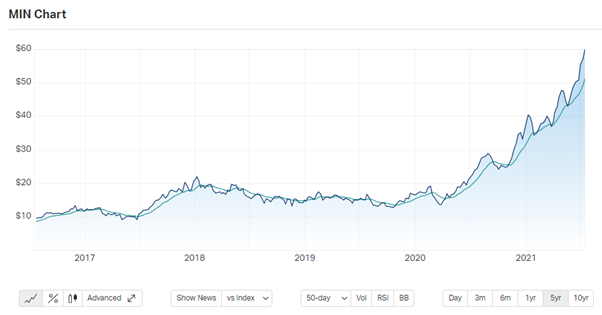
The only concern with the above is potentially SUL as it is just starting to show a bit of a downtrend so I will have to keep an eye on that for the future and hope it does not continue.
The other listings all look to be in a nice uptrend which is great news.
July 2021 Selection
After going through the first three criteria, the following listings within the ASX200 meet the requirements.
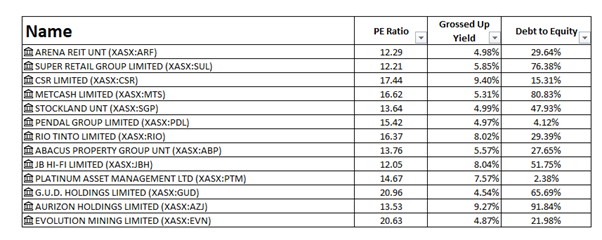
It is a relatively quick way to narrow the 200 or so listings on the ASX200 down to 13 companies using those three criteria. The final criteria for each listing is shown below.
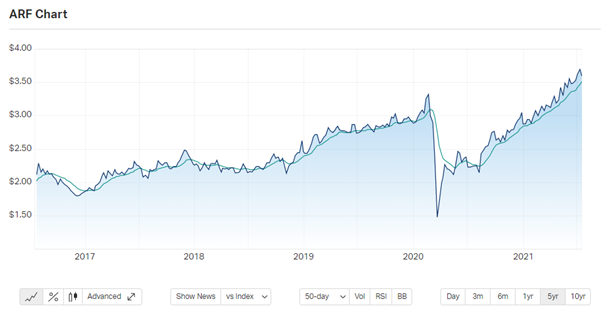
ARF was confirmed in our existing holdings to still meet the criteria, as you can see it is still in an uptrend.
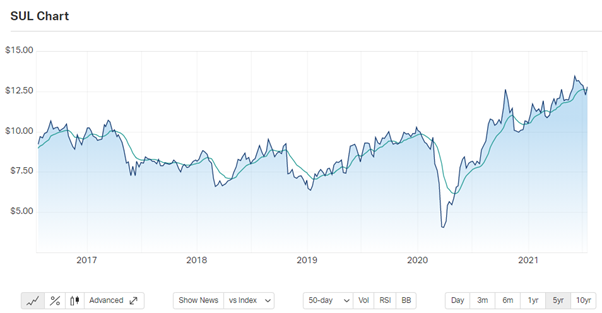
SUL shows a very slight downtrend right at the end, but could still be determined as a side trend given the short length of time.
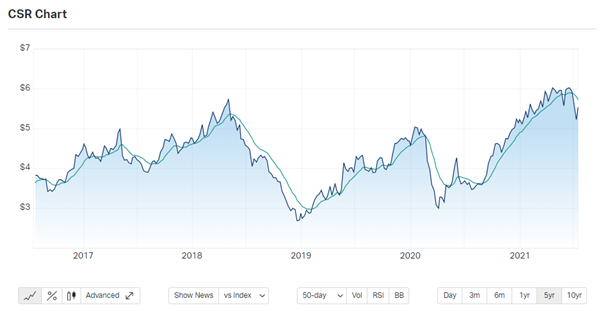
CSR also shows a slight downtrend recently, I would still class this as a sideways trend given the short timeframe.
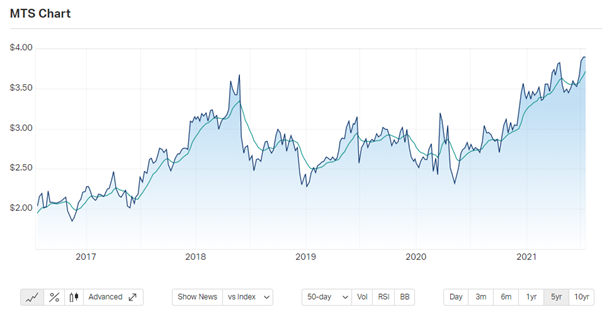
MTS appears to be in a fairly steady uptrend for the time being.
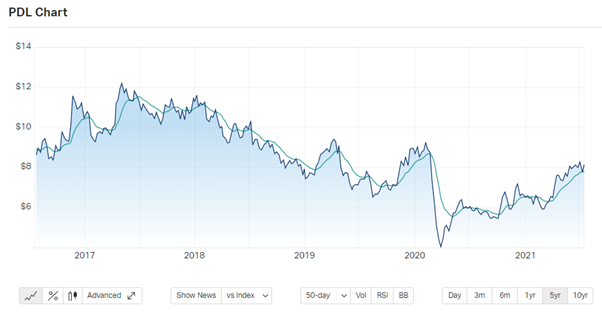
PDL has been in a nice uptrend for the past 6 months at least.
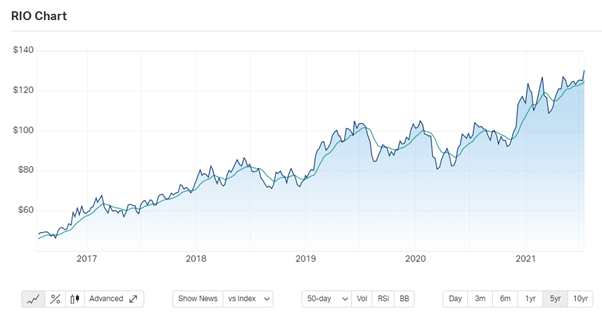
RIO also appears to be in a long-lasting uptrend.
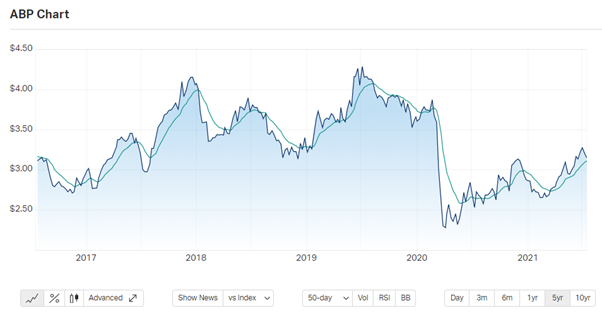
ABP has been in a nice uptrend for the past 4-5 months.
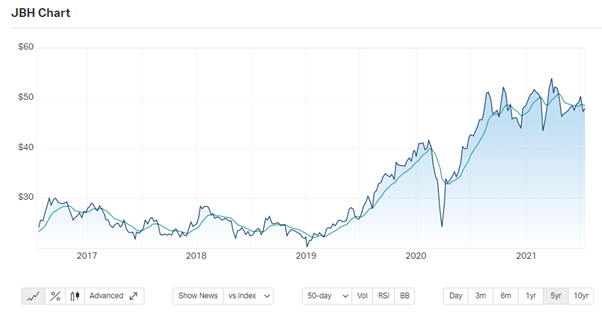
JBH looks to be in a sideways/downtrend at the moment. I would not say this meets the required criteria.
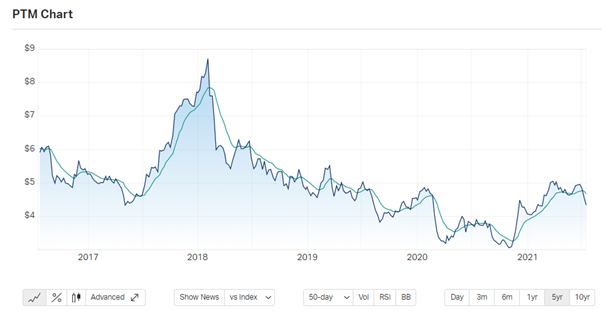
PTM appears to be in a sideways / uptrend at the moment.
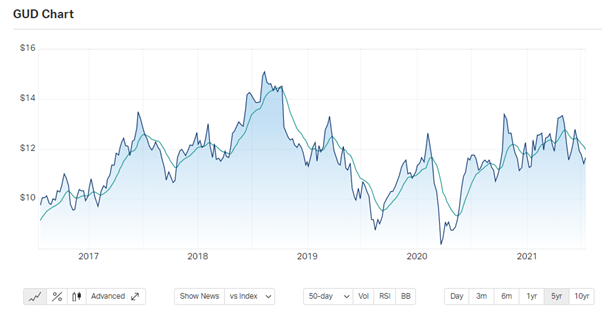
GUD is in a downtrend at the moment, this would not meet my criteria.
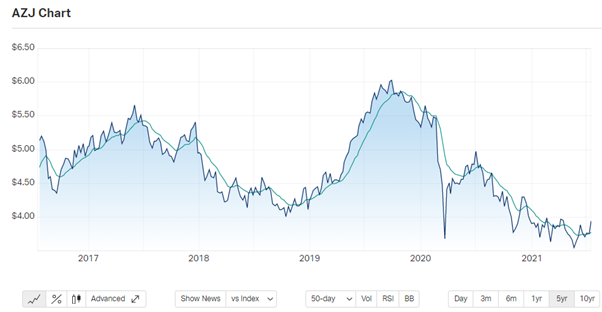
AZJ has been in a long downtrend for about 18 months now. It does appear to be sideways most recently, but I would still not allow this past the criteria.
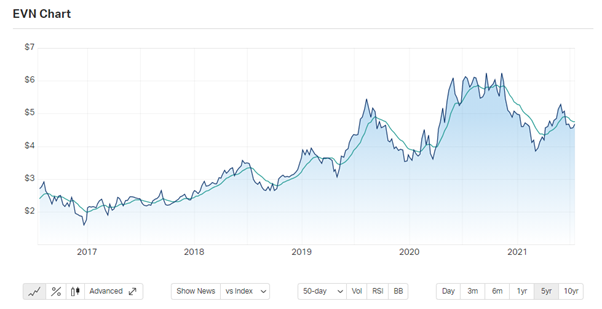
EVN appears to be in a downtrend at the moment, although it might continue to rebound as it started to a few months ago. Regardless, I would not allow this past this criterion.
Trend Summary
I have been able to eliminate the following Listings based on the trend:
- EVN
- JBH
- AZJ
- GUD
I am now left with the following (the highlighted listings are the ones I currently hold already).
Stock Selection
This can be difficult as there are still 9 different stocks to choose from, but I guess it could almost be a part where I am spoilt for choice as they are all good quality companies with strong fundamentals. For ease of future tracking, I might look at sticking to companies I do already own.
- 1,388 Shares of ARF bought at $3.60 per share ($4,996.80 total)
- 38 Shares of RIO bought at $130.60 per share ($4,962.80 total)
- 83 Shares of MIN bought at $59.99 per share ($4,979.17 total)
Comparison Purchase
120 shares of A200 bought at $124.00 per share ($14,880.00 total)
Summary of Holdings in the following table:
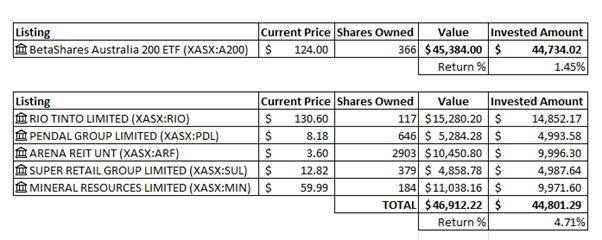
I will continue doing this each month, reviewing, monitoring, and hypothetically purchasing more shares. I am not sure if this will provide any sort of benefit in terms of a better return compared to just investing passively, but it does not take too long and if it does provide good returns, it might be an interesting opportunity.