Recovering from a Share Market Crash
One of the biggest concerns for anyone on the FIRE journey, and investing journey in general, is the potential for a significant share market crash that will wipe out a large part of your portfolio in a short timeframe.
Rest assured, if you invest in the share market over a long period, you will no doubt encounter several crashes, corrections, drops in the market, whatever you want to call them along the way. In these crashes, it is not unlikely that you will end up losing up to 50% of your portfolio. There is a reason why there is so much research into safe withdrawal rates and sequencing risk, both of these relate to your ability to persevere through a share market crash.
I did this POST before about recovering from a crash by adjusting your SWR while you are already post-FIRE, and how being flexible with your expenses is crucial to being able to recover and ensure your portfolio will last your lifetime. In this post I want to look more about how long it can take to recover while you are still in an accumulation period of your FIRE journey.
Methodology
I will use the SPY ETF once again as the historical data is readily available and it provides enough of a history to cover the last few crashes over the past 30 years.
I will have two different simulations, one for lump sum investing and one for regular monthly investing. Each simulation will compare either investing in the share market or investing in a guaranteed pre-determined return. This guaranteed pre-determined will be the base case scenario, and once the share market has reached this scenario, it will be deemed as “recovered.”
Market Crashes
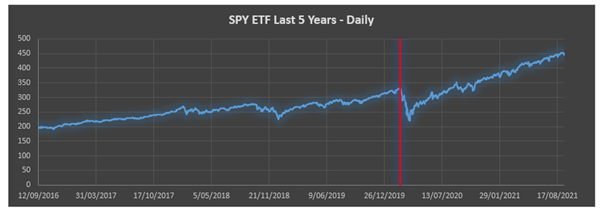
Below is a chart of the SPY performance, one since inception and one over the past 5 years. I have marked out which market crashes I will analysing in this post.
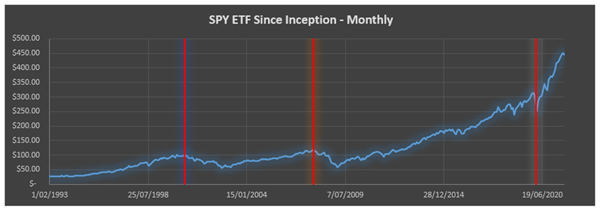
The three crashes I will be examining will be the following:
2000 Dot Com Crash
Peak 1/8/2000 – 102.64
Trough 1/9/2002 – 56.48
Drop: 44.97%
2007 GFC
Peak 1/10/2007 – 117.23
Trough 1/2/2009 – 57.69
Drop: 50.78%
2020 Covid Crash
Peak 19/2/2020 – 329.97
Trough 23/3/2020 – 218.72
Drop: 33.72%
I had to include the last 5 year daily historical data because the 2020 Covid Crash was sudden and the recovery was quick, meaning it was hard to see in the overall chart.
Just from the outset, you can see how much more long term the 2000 Dot Com Crash and the 2007 GFC Crash were compared to the 2020 Covid Crash. The Covid Crash lasted just over a month, while the other two lasted close to two years. The drop in the market during the Covid Crash was also less than the other two crashes.
Inputs
Lump Sum Investing Simulation
Amount: $100,000.00
Base Case Return: 6.00% per annum (compounded monthly)
I will use the following state dates for Lump Sum investing:
- Invested at peak (worst case scenario)
- Invested 12 months prior to peak
- Invested 24 months prior to peak
- Invested 36 months prior to peak
Regular Investing Simulation
Amount: $2,000 per month
Base Case Return: 6.00% per annum (compounded monthly)
I will use the following state dates for Lump Sum investing:
- Starting Regular Investing at Peak
- Starting Regular Investing 12 months prior to peak
- Starting Regular Investing 24 months prior to peak
- Starting Regular Investing 36 months prior to peak
- Starting Regular Investing 48 months prior to peak
- Starting Regular Investing 60 months prior to peak
- Starting Regular Investing 72 months prior to peak
Results
Lump Sum Investing
2000 Dot Com Crash
Peak – 1/8/2000 – 102.64
Trough – 1/9/2002 – 56.48
Duration: 761 Days with a loss of 44.97%
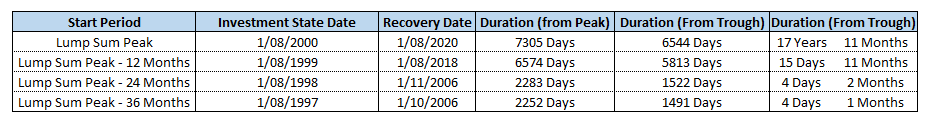
As you can see there is a very slow recovery if you had invested right at the peak, and even if you had invested 12 months prior to the peak. 6,544 days represents almost 18 years until you are able to recover.
Below is a graph showing the recovery from the 2000 Dot Com Crash if you had invested your lump sum amount right at the peak.
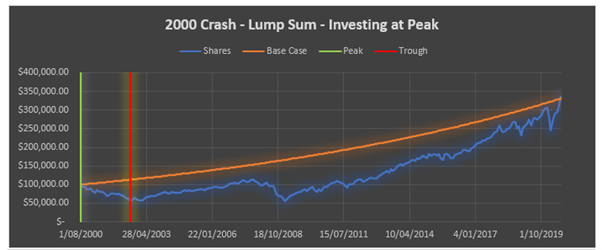
It does not help that through the recovery it does hit the GFC Crash in 2007 which only prolongs the recovery even further.
The orange line in this graph is a 6.00% per annum return from the investing state date, this is our benchmark which takes almost 18 years to reach.
The 24- and 36-month simulations recover significantly quicker as they are able to recover prior to reaching the GFC Crash in 2007.
The other graphs showing the recovery are located HERE.
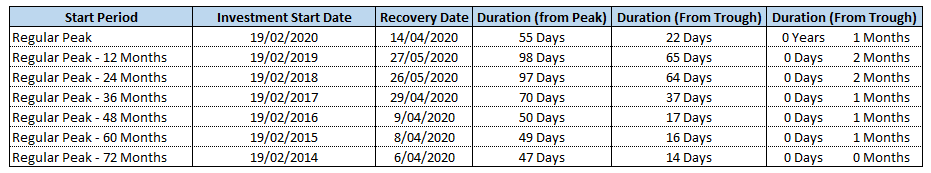
2007 GFC Crash
Peak – 1/10/2007 – 117.23
Trough – 1/2/2009 – 57.70
Duration: 489 Days with a loss of 50.78%
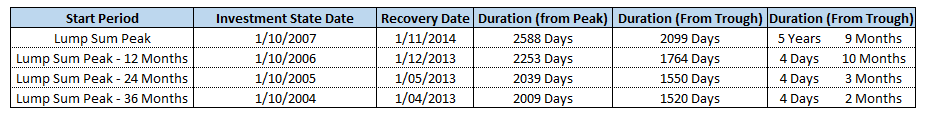
Despite the crash being slighter deeper than the 2000 crash, the recovery times were significantly shorter for the worst-case scenario of investing at the peak and investing 12 months prior to the peak.
2,099 days still represents just under 6 years, so it is still long recovery process, and keep in mind that this is related to the trough, which took over 1 year to reach in the first place.
All the graphs showing the recovery are located HERE.
2020 Covid Crash
Peak – 19/2/2020 – 329.97
Trough – 23/3/2020 – 218.72
Duration: 33 Days with a loss of 33.72%
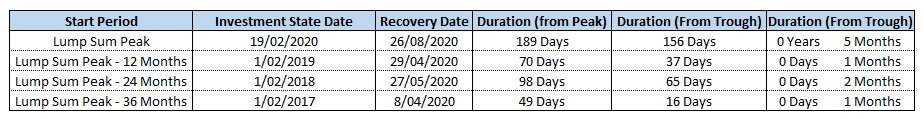
Even if you had invested at the worst possible time, right at the peak in February 2020, you would have recovered in 156 days from the low point, around about 5 months’ time. It was really a spectacular recovery compared to other previous crashes, and I do not feel it truly respects the significance that a crash can have on a portfolio.
Below is a chart showing the recovery for the simulation of investing 36 months prior to the peak
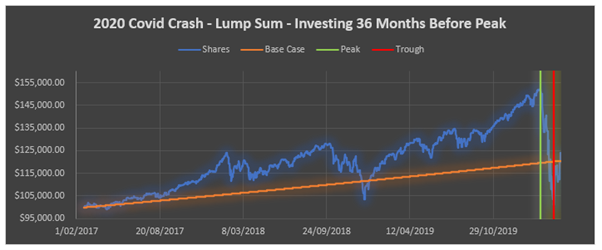
One thing I find interesting, is that the share price is still significantly below where it was at the peak, but since there was such a sudden rise prior to the crash, we were already so far above the base case 6.00% return that we did not need a full recovery in terms of share price to “recover” as per the parameters in this post.
All the graphs showing the recovery are located HERE.
Regular Investing
2000 Dot Com Crash
Peak – 1/8/2000 – 102.64
Trough – 1/9/2002 – 56.48
Duration: 761 Days with a loss of 44.97%
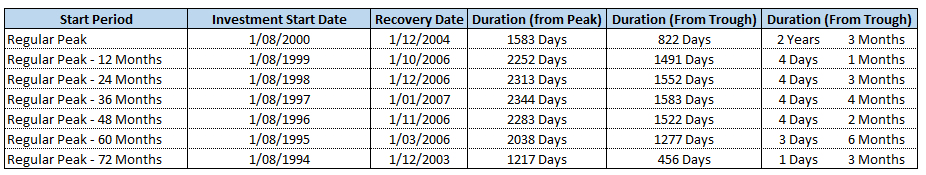
With regular investing it actually appears to be best case scenario to start investing right at the peak, I assume this is because there is less money to lose when the crash does occur, as you can see where if you were investing for 24-48 months prior to the peak it took the longest to recover. The longer term investing of 72 months appeared to be able to have enough gains prior to crash to recover relatively quickly.
Below is an example of the recovery for the 36-month period simulation.
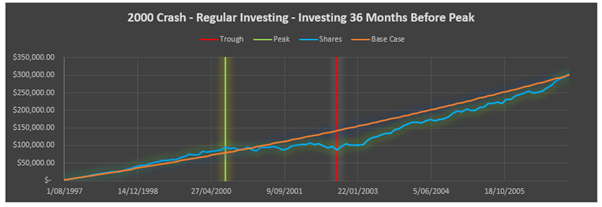
It is interesting to see that although the market is dropping over the period between peak and trough, because there is money being regularly invested the portfolio is able to maintain a pretty steady amount.
The other charts are shown HERE.
2007 GFC Crash
Peak – 1/10/2007 – 117.23
Trough – 1/2/2009 – 57.70
Duration: 489 Days with a loss of 50.78%
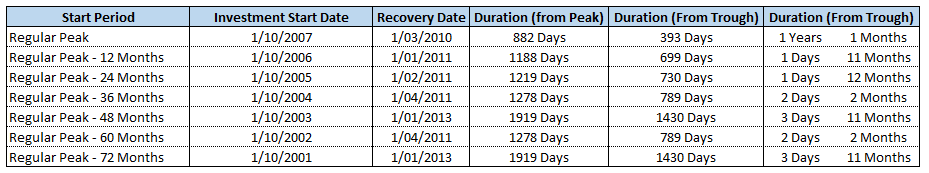
Recovery times are a bit quicker than the 2000 Crash, but still, most of them are taking over 2 years to fully recover after the trough.
It is also interesting to see that even if you had invested 72 months prior to the peak, it was equal worst performing in terms of recovery. I am also not sure exactly why the 60-month simulation performed so much better compared to the 48- and 72-month simulations. I would assume it is because of just fortunate timing more than anything. I will look at the charts for 48, 60 and 72-month simulations below to see if there is anything to indicate the reasoning.
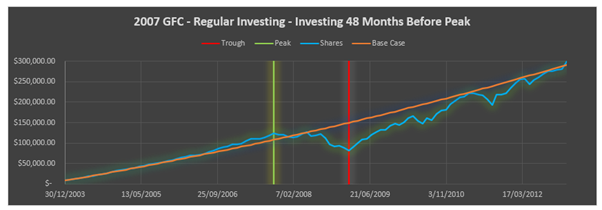
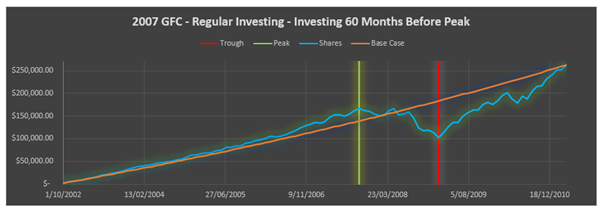
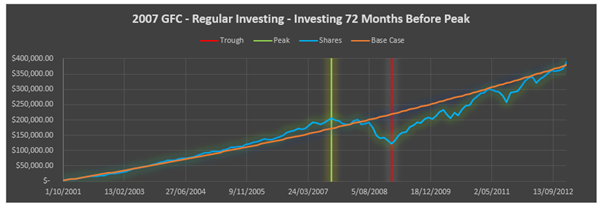
As you can see in the 48-month and 72-month simulations, there are a couple instances where it is really close to “recovering” in April 2011 and again around March 2012, but it fell just short due to some unfortunate timing.
I suspected this would be the case, but it still looks interesting that there was a case in the middle which performed so much better than the cases either side.
The charts for all the scenarios can be seen HERE.
2020 Covid Crash
Peak – 19/2/2020 – 329.97
Trough – 23/3/2020 – 218.72
Duration: 33 Days with a loss of 33.72%
As with the lump sum investing scenarios, the recovery times for the Covid Crash were ridiculously quick. The longest recovery period is just over two months, which is significantly less than the 6-year recovery periods in previous crashes.
Below is a chart of the investment period starting 12 months prior to the peak. The reason the lines are all “stepped” is because this was using daily data, as opposed to monthly data, and there was only investing once per month which shows significant jumps in the value.
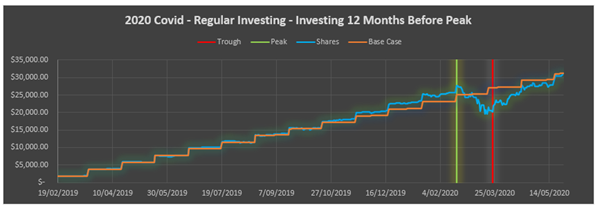
The market bounced back so quickly after the crash, which also dropped quickly, that it was always going to be a quick recovery no matter when you had invested.
The charts for all the scenarios can be seen HERE.
Summary
There will always be crashes or corrections or downturns, whatever you want to call them, if you invest in the share market over the long term. But the market will always recover, eventually. It may take several year, potentially a decade to financially recover from a crash, but if you are playing the long game then you will still come out on top eventually. The absolutely worst thing you can do is get cold feet when the market is dropping and ending up selling your holdings. Before you sell, you only have a loss on paper, as soon as you sell, that loss is locked in.
For people who have only started to invest recently and have only experienced the Covid Crash as their only significant downturn, I am concerned that this may have given a bit of a false illusion at how quick a recovery can actually be. This may in turn give people confidence in their ability to “ride out” a downturn, but it is a lot easier to ride out if you are only having to wait 6 months or so, compared to 10 years.
This post has talked about holding a lump sum, or regularly investing money throughout a crash in the market. That is all well and good, but I have not touched on if you have to start withdrawing your money if you have hit retirement. I have covered that in this POST here which shows how you have to be flexible if you want to be able to recover from a crash while in your retirement.