Picking Shares with Strong Fundamentals
Just about all of the talk about investing within the FIRE community is about investing in ETFs/Index Funds and basing returns from overall market growth rather than pinning your hopes on an individual company.
This is a great, passive way of investing in the share market. It is about as “hands free” as you could get with share market investing. And there are studies that show that investing in index funds provides better returns than investing within an active managed fund, where it is literally their job to beat the market.
This Study provides a good summary of one such study. Just one example, the Australian General Equity managed funds (which are compared to the ASX200), were outperformed by the market index 80.18% of the time over a 15-year period. It does beg the question, what do you pay for with a managed fund and why would you go away from just investing in index funds?
The whole managed fund vs Index fund is an argument for another day, but in this post, I wanted to explore, if we wanted to for instance, we could look at finding solid individual shares with strong fundamentals that could potentially form part of our portfolio.
So How do we find shares with strong fundamentals?
In this post, I will be using the criteria outlined in the book “Shares Made Simple” by Roger Kinsky. I wrote a full review of this book located HERE. If you are interested in individual share investing, then I recommend reading it as it is really useful in being able to decipher the mountains of data that seem to come with share listings.
Initial List
The initial list of shares will be from the ASX200 – one of the criteria is for relatively large cap shares. Investing in low cap shares is closer to speculating than it is to investing, so for these purposes I am not really interested. And to limit the number of shares, I will just stick with Australian shares.
This is our initial list of shares:
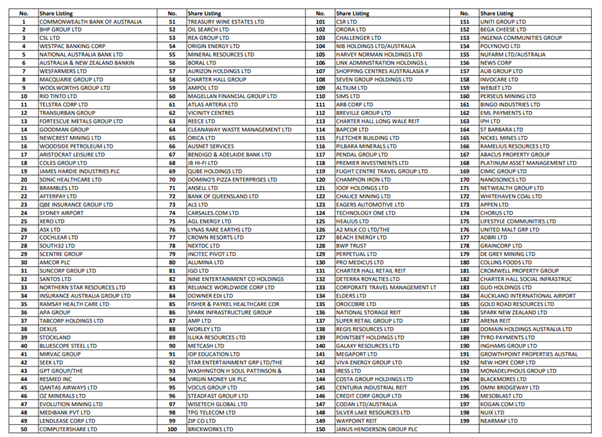
As you can see, even by limiting it to the top 200 (actually 199 in this case), it is still a vast number of shares. Now we need to analyse these further so we can eliminate the ones that do not give us the fundamentals we are after. I apologise if the above list is difficult to read, it is a large list and I did lose some resolution putting it into this post.
First Criteria – PE Ratio – Price to Earnings Ratio
The PE Ratio is one of the main criteria used by people to analyse shares, it is readily available for just about every share listed. Simply put, it is the following formula:
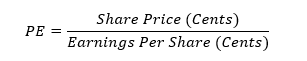
Earnings Per Share (EPS) is calculated using the published (or announced) earnings for the year to date divided by the number of shares on issue. It is important to note that a company’s earnings statistics are usually published only every six months and that there could be a two-month delay between the end of the period and the finalisation of the financial statistics. Therefore, the published EPS for the year to date will be up to a date for a period that’s between two and eight months backward in time.
What is a good PE Ratio? For the criteria required for us will be between +/- 5 of the standard market average of about 16-17. If the PE is between 11 to 22 it will pass the first criteria.
The following is a list of the Share listings that passed the first criteria. These values were determined from Excel Stocks features (however it should be noted that I did see a couple errors from share websites, so make sure you do double check the figures before you take them as gospel).
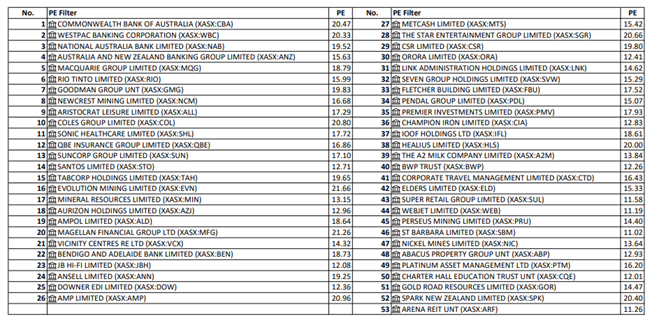
We are getting there at least, already removed about 75% of our initial list, but still over 50 shares remain on our list to further analyse. At least we can start to be able to read this list!
Second Criteria – Grossed-Up Yield
The focus between yield and growth is quite divisive within the FIRE community I have noticed. Some people are adamant on acquiring shares with high yields, and others believe the focus should be on shares that just provide stronger capital growth.
Personally, I do not think yield is everything, but if there is a history of strong dividends then I see that as a good sign, but my preference is still for higher growth.
As you can see, I used the term grossed up yield, rather than just yield. So, what is the difference? Well basically, Grossed Up Yield just converts fully franked dividends (or partially franked dividends) into unfranked dividends. Given some companies provided dividends franked, unfranked or partially franked, this just provides a level playing field for comparison purposes.
The criteria I will use is a Grossed-Up Yield over 4.50%. It is important to check previous years results as well because you want to make sure there is not an anomaly in the recent data points that is not likely to happen in the future.
I was able to find dividend information using https://www.marketindex.com.au/
Below is the list of shares we have remaining after applying the Grossed-Up Yield Criteria.
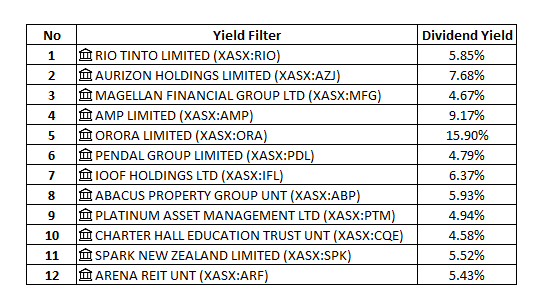
As you can see, we are really narrowing down our list to a select few shares.
Just for information, Orora Limited did seem to have a ridiculously high Dividend Yield for the year, but looking at previous years, the yield was still around the 4.00% – 6.00% mark, so while this year it seemed higher than normal, even in previous years it is at pretty decent levels.
Third Criteria – Debt to Equity Ratio
Debt to Equity (DE) is important to know because you do not want to invest in a company which is leveraged over its head, just imagine your own situation. If you had a mortgage that was at the absolute top limit of what you could afford, what happen if you lost your job? Or even were forced to take a pay cut for whatever reason? Pretty soon you would be in a lot of trouble, and the same applies to businesses. I do not want to invest in a company which has high levels of debt relative to their equity.
The maximum Debt to Equity Ratio for this criterion will be 100% (but preferably less than 80%)
I was able to find the DE Ratio using the following website – https://au.investing.com/
It is worth noting that the DE Ratio shown on official listings it is not accurate for Banks and Insurance companies due to long term mortgages and outstanding insurance claims. You can manually determine the DE Ratio using the long term debt provided divided by the shareholder equity however.
After applying this criterion, the following is the list of remaining shares:
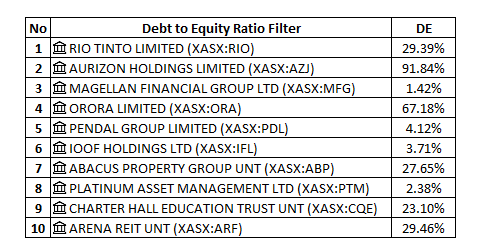
Almost there, we are down from 199 shares down to a select 10 that has met all of our criteria so far. There is one more left to determine which shares will meet our criteria for a share with strong fundamentals.
Fourth Criteria – Chart Criteria
I am not the biggest fan of trying to analyse charts, it is impossible to predict the future and trying to find patterns in trends to do so in my opinion is not a productive way to pick stocks. But given we have already analysed these companies through other criteria, it might help us just make the final decision with what shares to invest in.
So, what charts do we actually look at? Anyone who has done even basic analysis of shares, knows that there is seemingly an endless number of charts that can be looked at, lots of lines on a graph telling you all sorts of information.
For our purposes, we will be using a 50-day SMA (simple moving average) on a five-year chart, with our criteria being that our share is not in a downtrend. The book actually recommended a 70-day SMA, but the website I was using did not have that as an option and I think 50-day is close enough for my purposes. Again I am using https://www.marketindex.com.au/ for these charts
Rio Tinto
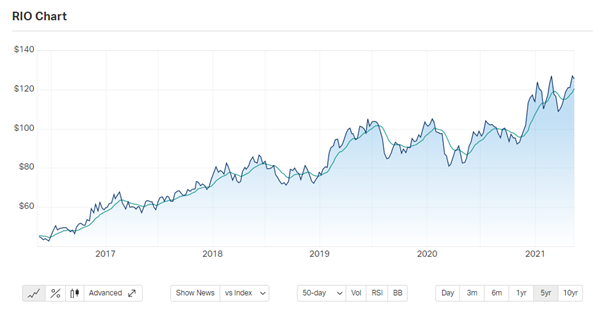
Although the 50-day SMA is somewhat up and down over the past couple of years, overall, it is in an uptrend, so it will meet our criteria.
Aurizon Holdings
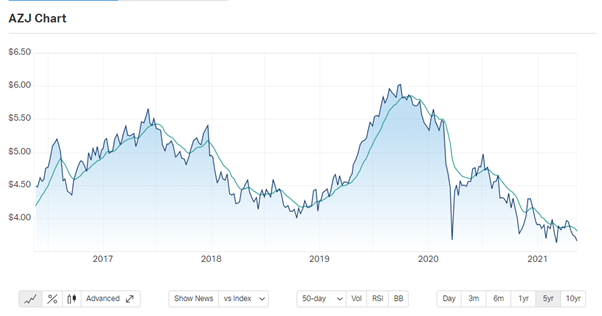
Aurizon is clearly in a downtrend, so it does not meet our criteria. The DE Ratio was slightly higher than I would have liked as well at 91.84%.
Magellan Financial Group
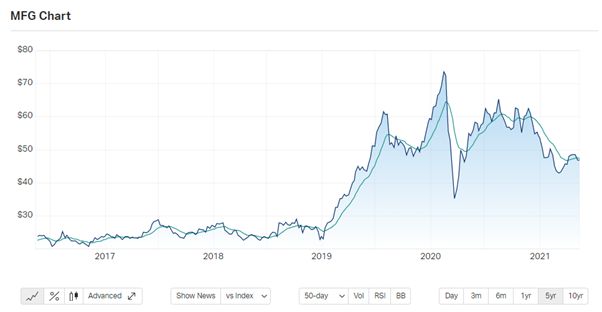
Magellan is in a downtrend at the moment so it will not meet our criteria.
Orora Limited
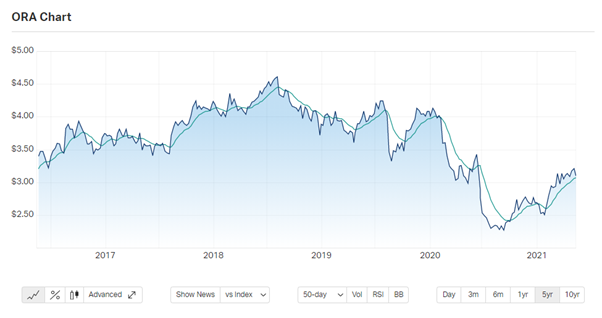
Orora has been in a good uptrend since the middle of 2020 so this will meet our criteria.
Pendal Group
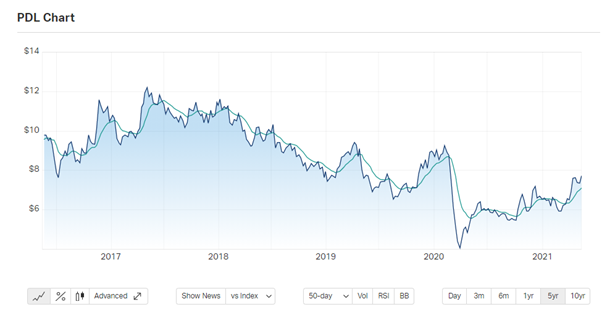
Pendal Group has been going mostly sideways/uptrend over the past 12 months so it will meet our criteria.
IOOF Holdings
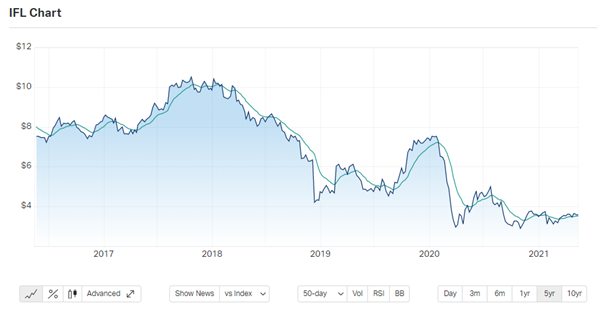
You could argue that IOOF is in a sideways trend, but I would still call it in a downtrend over the past 3 years so this would not meet my criteria.
Abacus Property Group
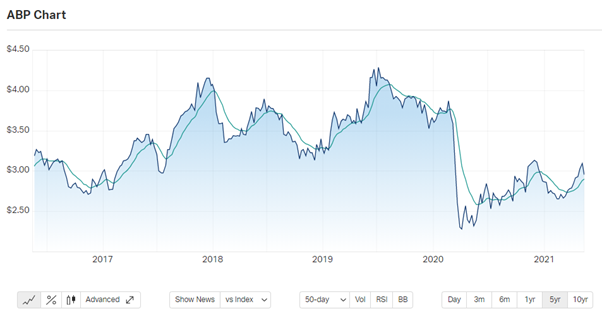
Abacus is slightly sideways/upwards, it does look like growth might be somewhat slow over the next while, but it looks like the overall trend will be upwards. This would meet my criteria.
Platinum Asset Management Group
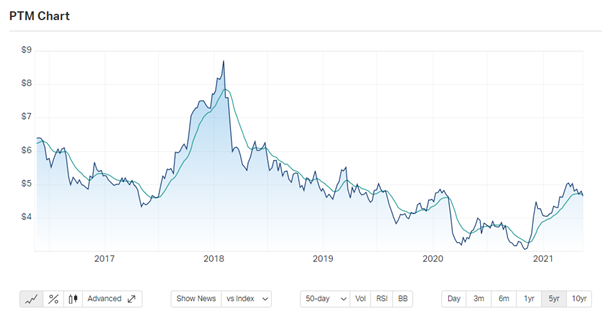
Platinum Asset Management Group is another tricky one to analyse, it does look to be in an upward trend over the past 5 months, but there was a long 3-year downtrend before that would have me concerned. I would not have this share as meeting my criteria.
Charter Hall Education Trust
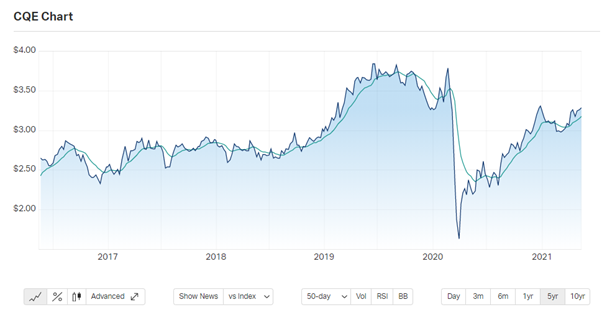
Charter Hall Education Trust looks to be in a decent uptrend since the Covid crash early 2020, this would meet our criteria.
Arena REIT
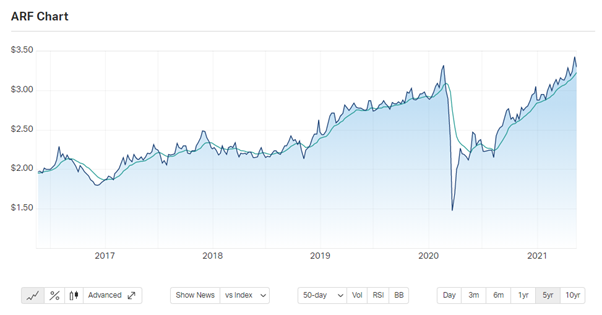
Similar to other shares, Arena REIT appears to be in a strong uptrend since the Covid crash, this would meet our criteria.
Summary
Now we have gone through all our criteria and we have the following shares remaining.
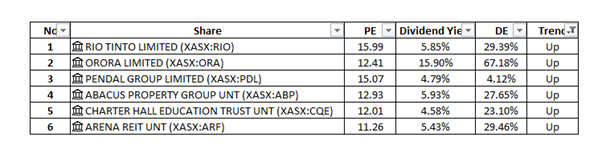
We have been able to narrow down 199 shares from the ASX200 down to 6 shares that meet our criteria to show that each have strong fundamentals.
How do you decide which ones to invest in now? One thing to look at is some sort of diversification, so if you were only going to pick 3 shares to invest in, you might want to make sure they are not in the same sector.
The remaining 6 share listings fall under the following sectors:
Materials: Rio Tinto and Orora
Real Estate: Abacus, Charter Hall and Arena
Financials: Pendal
Given the above, you may want to pick one from each sector to provide some diversification.
Financial Sector – Pendal (the only share within this sector that met the criteria)
Material Sector – Rio Tinto (I preferred the lowered DE Ratio, and I believe the long term yields will also be higher)
Real Estate Sector – Each listing is very similar to the other, it is difficult to choose, but also at least it means whatever we do choose it should not be too critical as they all seem to be strong choices. For the purposes of this exercises I will select Arena REIT because it looked to be in a better uptrend than the other two options.
Simulation
I will not actually be buying shares, but I want to hypothetically do some purchases over the next few months and see if there are returns that surpass the market to see if it is worth pursuing for myself in the future.
$5,000 will be spent on each share:
Rio Tinto: Current Price – $125.43 – 39 units bought for $4,891.77
Pendal Group: Current Price – $7.73 – 646 units bought for $4,993.58
Arena REIT: Current Price – $3.30 – 1,515 units bought for $4,999.50
I will monitor this next month and provide updates to see how my hypothetical portfolio is going and compare it to returns from the ASX200.
For comparative purposes, A200 is currently priced at $118.87
Conclusion
This is the first time I have ever gone into any in depth analysis of Share listings, and I feel I worked my way backwards given I started investing in ETFs well before I gained an understanding of the fundemental building blocks of how shares work and the individual analysis that can go into each share listing.
Personally, this sort of activity I find interesting as data analysis is something I am very much into and I thoroughly enjoy going through spreadsheets and charts trying to find small advantages here and there. Will this analysis pay dividends? (pun intended) – well, given how basic this analysis has been, and how much work is put into share analysis by people who do it for a full time living, I doubt it will perform amazingly well. In all likelihood, I will probably struggle to beat the market. I could be wrong, however, and maybe putting in a little bit of extra work might be worth it in the long run if it is able to provide strong returns.
All up, carrying out the analysis of the ASX200 took approximately 1 hour to narrow it down to the 6 shares that fit all the required criteria. I do not believe this to be a burdensome use of my time and hopefully I should not have to do anything like this more than once every couple of weeks at most.