My own “Race to $1,000,000”
In a previous post, I have talked about how the first $100,000 typically takes the longest to generate. After this, every $100,000 should in theory be generated in a shorter length of time. You can read about this in more detail in this POST.
I decided I wanted to have a bit of a look at how my wealth creation has gone over time, to see if my reality met up with theory. It was a somewhat difficult however, as I did not track my net worth in any significant detail until early 2020, so a lot of my earlier $100,000 milestones were only best estimates.
Milestones
On this page HERE, I have gone through best estimates for a series of Milestones that I have generated on my FIRE journey.
In summary –
$50,000 Net Asset Value – Reached 1/6/2012
$100,000 Net Asset Value – Reached 1/1/2014
$250,000 Net Asset Value – Reached 1/12/2015
$500,000 Net Asset Value – Reached 1/6/2017
$625,000 Net Asset Value – Reached 1/12/2018
$750,000 Net Asset Value – Reached 1/6/2019
$957,000 Net Asset Value – Reached 1/4/2021 (this was not a Milestone, just my current point as I made this post)
$1,000,000 Net Asset Value – Reached 23/5/2021 (UPDATED on 23/5/2021 but not included in graphs below)
Calculations
I have assumed linear growth between each of the milestones above to predict when each $100,000 milestone was achieved. Once I have a linear growth of my wealth over time, I can have a look at how many days it has taken to achieve each Milestone.
The below is a graph of what it should look like in theory:
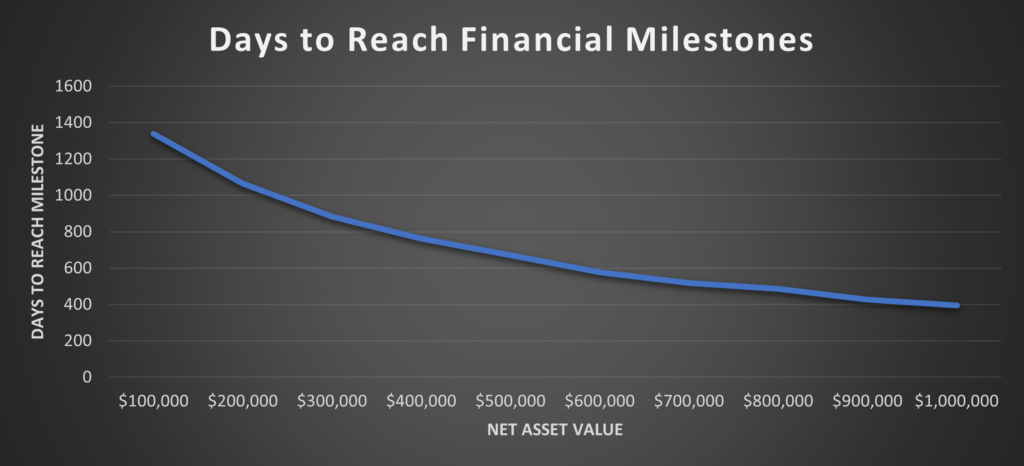
The above graph assumes investing $2,000 per month with an investment return of 7.00% per annum.
Reality quite often differs from the theoretical for a variety of reasons. So, it would make sense if my own personal wealth creation journey differed from the textbook example.
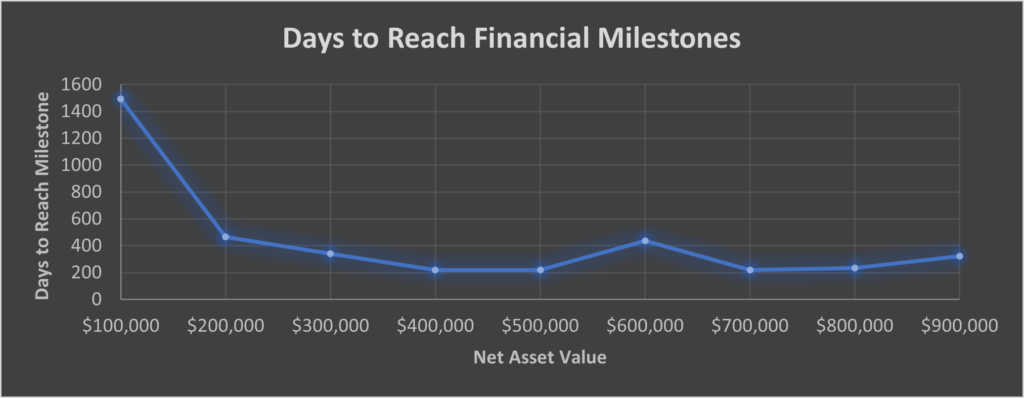
Below is how my own personal graph looks currently:
Analysis
Well, it is at least true that the first $100,000 took the longest for myself, in fact it took significantly longer than my subsequent $100,000 milestones.
To analyse further, I need to have a look at the dates that correspond to each milestone so I can have a think about what I was doing in my life to provide such results.
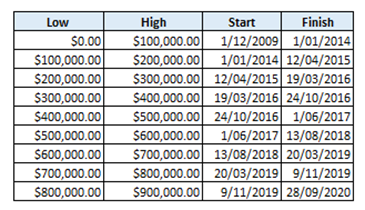
Above is a table of data which shows the start and finish dates for me to achieve each milestone.
I started working fulltime at the start of 2009, and for the first couple of years I was saving up for a house deposit for my PPOR. After I bought the PPOR, my savings was going towards the offset loan until 2012. So, although I was saving a fair bit of money at the time, the majority of it was going towards my PPOR and hence it was not increasing my net asset value. If I did include my PPOR value in my net asset value then it would have changed the numbers significantly.
In 2012 was when I first started “investing” when I started to purchase US Property. Although the majority of my savings was still going towards my offset account. And in the middle of 2014 I bought another PPOR, so again, while I had a decent amount of savings, it was all in my PPOR so not adding any net asset value.
Between 2012 and 2017 I was working FIFO in the mines, and my income increased significantly. Not only that, but during this period is when I really started to invest in US Property, purchasing another three properties. All of my other savings was only used to pay off my PPOR.
My US property increased in value significantly over a short period of time, this is where my wealth started to grow very quickly as indicated by the short durations between $100,000 milestones.
During 2018, I took a long break off work to do travelling around Australia, so this explains why my asset growth to the $600,000 milestone took longer than the rest of the graph.
I returned back to work in late 2018, and since that time I have been selling my US property, and bringing the money back to Australia. This is why the $900,000 milestone has taken longer to reach than the earlier milestones, because there were significant real estate fees and other selling costs.
A lot of the above is only estimates however, as I said earlier, unfortunately I did not really start tracking my net worth until July 2020. It would have been a lot more useful if I had a more accurate dataset to base these figures off.
So What is Next?
Well, I am looking forward to hitting the $1,000,000 milestone, which hopefully should happen later this year. However, early next year I will be looking at buying my future retirement PPOR, so it will impact my net worth with the purchasing costs.
If there is not a significant crash in the next few months, I should reach $1,000,000 by 1/8/2021. This will mean it would have taken me about 300 days to go from $900,000 to $1,000,000. So again, it is not the quickest wealth growth that I have achieved in my overall growth, but I am still happy with enough with that progress.
UPDATE: I actually reached $1,000,000 net asset value on 23/5/2021 – this was due to an increase of my IP value was unexpected. This means it took me only 237 days to go from $900,000 to $1,000,000 (also note that my net value has actually increased to $1,047,000 after the recent price increase so I am well on my way to the next $100,000 milestone as well).
It will also be interesting to note, that while the future PPOR will be an IP, I will have it added into my net asset value, which will artificially increase my net asset value, especially as I pay down the mortgage or if the property increases significantly in value.
It is interesting to see that currently my plan is to reach a FIRE number of $1,250,000 before I retire, but just before I do retire, when I am still renting, my net asset value might actually be around the $1,700,000 or so.
Conclusion
I guess the above just goes to show that at the end of the day it is all just numbers on the screen which can be manipulated to show better or worse results than what reality is showing. So, while I feel I am in a strong position financially, someone could have half the net asset value, but own their own PPOR worth $600,000 outright, and be in a stronger position.