Investment Risk vs Savings Risk – Part 2
Initially, I did not intend to have a Part 2 on this topic, but after writing up this POST, where I measured the financial risk of investing/saving over a short period of time (up to 5 years), it got me thinking. Instead of just measuring it based on an amount of money, I wanted to instead measure it based on time.
What I mean from measuring it based on time, is comparing how long it will take to accumulate a certain amount of money either by investing in the stock market, or by saving it in the bank.
Methodology
Similar to last time, I will again use the SPY ETF, mainly due to the amount of historical data is has available compared to other ETFs.
The base case scenario will involve saving $3,000 per month for a set duration (1, 2, 3, 4 or 5 years) with a return of 3.00% per annum (compounded monthly) to simulate a bank interest return. The amount accumulated at the end of the time-period will become the target amount to be reached by investing.
Using historical data, and investing $3,000 per month, starting at different times I will compare how long it will take to save up to the target amount.
This will also include $10.00 per month for brokerage fees and will have no fees associated with bank savings.
Results
The target amount for each time period will be as per the below:
- 1 Year – $36,590.40
- 2 Years – $74,293.72
- 3 Years – $113,143.84
- 4 Years – $153,175.61
- 5 Years – $194,424.99
Again. I have not included any capital gains in either the target amount or the stock market simulations, although it would be applicable and might affect the overall return received. It would only hinder the target amount more than the simulated amount. As there would need to be tax paid on any interest earned every year for the target amount, whereas the simulations will allow for a 50% CGT discount when the holdings were eventually sold.
The first table below is a summary of the simulations, compared to the base case scenario with a breakdown of the number of simulations which reached the target amount slower, faster or at the same time as the base case.
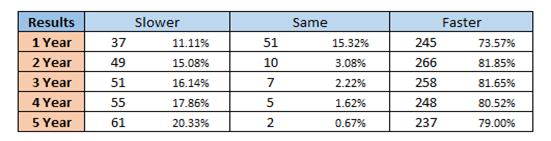
Similar to the findings on the original post, the majority of simulations provide a better alternative than saving in the bank. 74-82% of simulations across all time periods will accumulate the money faster than saving in the bank.
It is worth mentioning however that the number of simulations where it takes longer to accumulate the target amount is increasing as the time periods increase, whereas the simulations where it is faster seems to remain steady around the 80% mark.
It does seem logical that the amount of simulations where the target amount is reached at the same time, whether investing or saving, reduces given there is significantly more variance as the time periods increase. Not to mention that the return from share prices or interest will start to carry more weight the longer the time period is, causing the guaranteed monthly deposit to have less of an impact.
After seeing the above, I was curious what the trend would be if the time period was extended, so I tested out simulations which had a target amount accumulated after 10 years of saving in the bank ($420,272.32)
The results were as follows:
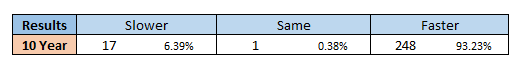
I was not surprised by this at all, as over time the return of the stock market has far exceeded 3.00% per annum. I was mainly curious about the % of simulations that were slower than the base scenario, and that number appears to have reduced dramatically down to around 6.00%.
I tested out time periods of 6, 7, 8 and 9 years – and while I have not prepared the results, it appears the % instance appears to hit a maximum of around 20% (as seen after 5 years), and after that it starts to taper down to a lower number.
Results – Magnitude of Deviation
Next, I wanted to look at the actual magnitude of the difference between the simulations and the base case scenario.
While it is interesting to see that 75% of simulations will perform better than the base case scenario, if those 75% of simulations are only 1 month better, whereas the 25% of poorer performing simulations are 10 months worse, then it might not be telling the full story.
The below graphs will depict the results of each simulation in a frequency column graph. The variance from the base case scenario is shown on the horizontal axis (where + months indicates faster, and – months indicate slower). The y-axis is the frequency the simulations occurred given each time period.
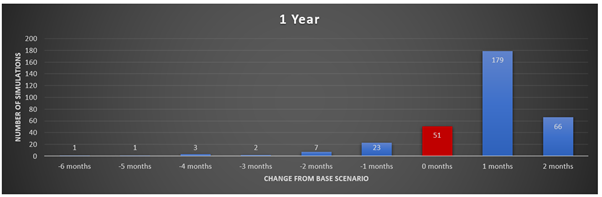
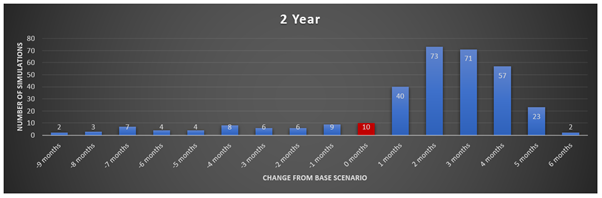
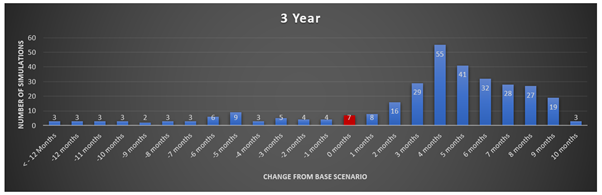
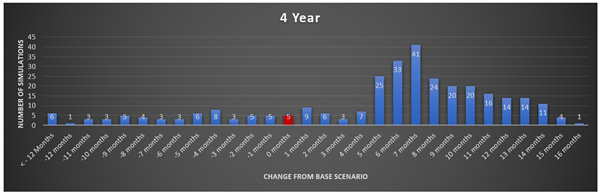
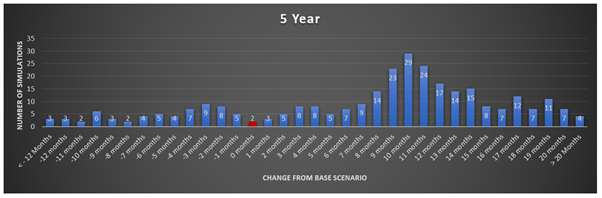
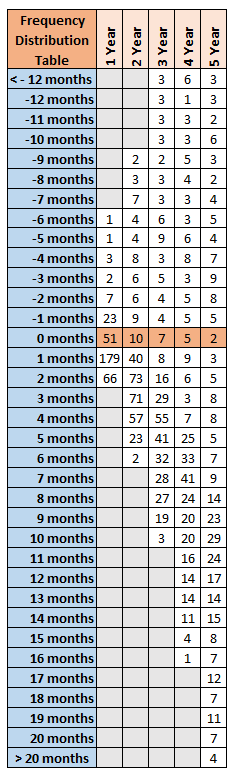
The above graphs might be hard to see, so below is a summary table of all the results. Unfortunately, it is not quite as aesthetically pleasing.
I will also show the below graph which is a combined frequency graph of all the time periods.
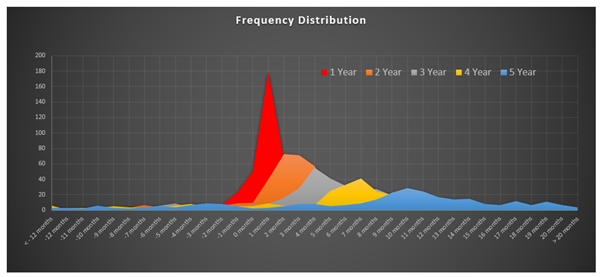
From the above graph and tables, you can see there is a “shift” in the predominant frequency towards investing in shares outperforming saving in the bank by a wider margin. Although it is worth mentioning that with the longer time periods, there is also a greater chance of more significant underperformance from shares (compared with shorter time periods).
Results – Average Performance
Lastly, I want to look at the average deviation between the simulations and the base case scenario.
1 Year: 0.74 Months Faster
2 Year: 1.69 Months Faster
3 Year: 3.27 Months Faster
4 Year: 5.29 Months Faster
5 Year: 7.69 Months Faster
As could be expected, the longer the time period, the greater the deviation from the base case scenario.
Conclusion
While I do find the results above interesting, although not too surprising, I believe it comes down more to risk and potential to determine which path you would prefer to go down.
For example, although according to the results, there is an 80% chance that you will outperform saving if you invest in shares over a 4-year time period.
Further to this, there is also a 64.00% chance that investing will outperform saving by a period of 6 months or greater.
But there is also a 10.00% chance that investing will underperform saving by a period of 6 months or greater.
The lower chance of failure might supersede and be more powerful than the higher chance of success, it all depends on the person.
It all comes down to someone’s own personal risk tolerance. As someone in the financial community said it is like a game of Russian Roulette, where 5/6 of the time you will be fine (and actually better off), but that 1/6 chance could be potentially devastating and in the end not really worth the risk.