Investing around Ex-Dividend Date
There always seems to be a lot of movement in the price of shares around the Ex-Dividend date, as I have covered in this POST, where I measured the change in price against the dividend amount. For the most part, the price of the share will drop by the dividend amount so there does not appear to be any cost benefit associated with investing at or around the Ex-Dividend date.
However, I was still curious to check it out for myself, to determine if there was a potential benefit by either investing the day before or day after the ex-dividend date. If there is an advantage to be had, why not exploit it for my own benefit in the future?
Methodology
I will use three ETFs for this post, VGS, VDHG and VAS, and I will simulate the following three scenarios:
- Invest on a monthly basis (with no regard for ex-dividend date)
- Invest the day before Ex-dividend date
- Invest the day after Ex-dividend date
Each scenario will have $5,000.00 per month in savings to be invested. Because there will be different periods between investments, I will attribute a daily figure of $164.27 to be saved, and when the purchase date is reached this figure will reset and new savings will start.
Using historical data available from Yahoo Finance, data of the share prices from inception of each ETF is readily available, as well as the Ex-dividend date and dividends amount. Using these figures, I am able to simulate each scenario since the beginning of each ETF.
Results
The below table is a summary of the results from investing over the lifetime of each ETF.
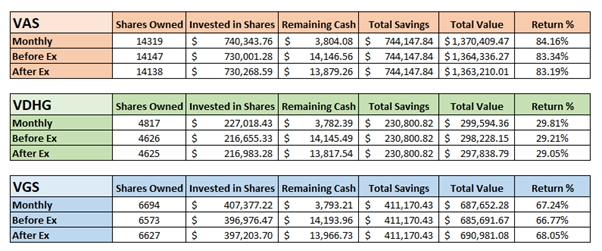
VAS was the longest running ETF, followed by VGS and the newest ETF is VDHG. As you can see by the “Remaining Cash” column, purchasing before or after Ex-Dividend date had much higher amounts, this is because it had been a while since the last Ex-Dividend date, so there had been a fair bit saved up until the next purchase.
With purchases occurring every quarter for these particular ETFs, the number of share purchases is significantly less than the monthly purchasing scenario. I have not included brokerage costs with these calculations; however, it would make a difference as there would be 3x as many purchases with the monthly scenario compared to either of the scenarios based on Ex-Dividend date.
It is also worth noting that this is only looking at the end result, and one thing I wanted to check if that the results were determined because it was a substantial timeframe since the last purchase date for the Ex-Dividend scenarios, so I wanted to look at the difference between return % over time for each ETF.
The below graph is a comparison between the return % between the Monthly Scenario, and whichever scenario out of the Before or After Ex-Dividend is performing best at that point in time. I was looking to see if results were consistent for the duration of the exercise.
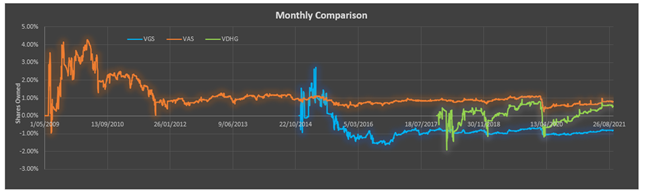
If the line is above 0%, it indicates that the monthly investment scenario is the best performing, if it is below 0%, then one of the other simulations is outperforming.
As can be expected, there is a fair bit of volatility early on for each ETF, this is due to the volatility of the ETF price after the monthly simulation has purchased but before the Ex-dividend scenarios have purchased.
There appears to be some interesting events which have occurred and brought on big changes in the graphs, I might look in depth at these changes and see if I can determine reasons why they occurred.
April 2020
The first one occurred for all three ETFs around April 2020, I assume it will have something to do with the Covid Crash, so the value of each simulation would have gone down, but I am curious why the Monthly Investing scenario dropped significantly for each ETF.
VDHG: This went from +0.83% on 21/2/2020 to -1.18% on 23/3/2020. There was a purchase of shares on the monthly scenario on 2/3/2020, and after this date the share price continued to go down significantly until it reached the trough on 23/3/2020. The Ex-Dividend scenarios instead were saving money over this timeframe, so instead of losing value of their investments, their money was maintaining its value over this time frame. Hence it performed better over this time.
VAS and VGS were similar over the same timeframe.
November 2018
There is a big drop in the VDHG simulation around this period as well. This simulation went from +0.41% on 8/11/2018 down to –1.14% on 2/1/2019. This one appears to be slightly exaggerated as it was relatively early on, so even small changes in the ETF price had significant impacts on this metric.
There was a 4.00% drop in the share price around this time, and unfortunately the monthly scenario purchased right at the peak on 3/12/2018 only for the share price to drop dramatically until it reached a trough on 2/1/2019.
Breakdown of % Returns
Finally, instead of looking at the better performing of the Ex-Dividend scenarios, I wanted to show graphs which show the direct comparison between the Monthly scenario and the Before and After scenario for each ETF.
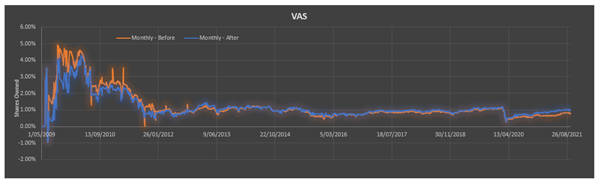
VAS is pretty consistent with the Monthly Scenario typically around 1.00% better than either of the Ex-Dividend scenarios.
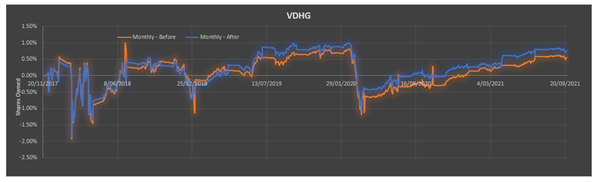
VDHG has a much shorter timeframe than the other ETFs, hence it is a lot more volatile throughout the simulation. It does end up overall with the monthly scenario returning more than either of the Ex-Dividend scenarios.
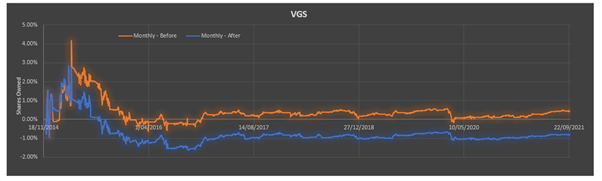
VGS is a different case, it is interesting that there is a significant difference between the Before and After Ex-Dividend scenario, with the After scenario performing better than the Monthly scenario, and the Before scenario performing worse. I am not exactly sure why this is the case, I would assume it is because the dividends might have too much of an impact on the price, so purchasing after ex-dividend payments might provide a “discount” if you were to purchase the ETF.
Summary
Overall, the majority of cases it shows that investing monthly provides the best return, however it is not a significant margin at the end of it (less than 1.00%), so it does not really appear to make a significant difference in your investing portfolio if you were to invest specifically around the Ex-Dividend date or not.
I might expand my data set for this simulation as only looking at 3 ETFs is not the most thorough, so potentially looking at individual shares, or US based ETFs as well might provide some interesting results.
For now I will leave this here but might expand on it in the future, at the moment it does not look to be much of an advantage to invest around the Ex-Dividend date, and once again it seems that just being boring with your investments, putting the money in regularly, regardless of what else is happening, seems to end up with near enough to the optimum result.