Individual Stocks Over The Past 12 Months
The last 18 months has been a crazy ride in the stock market, but for now I just want to just focus on the past 12 months. It has been one of the biggest rises in stock market history with returns +20% over a 12-month period. Will the rise continue or are we just getting closer to the bubble bursting? Well, I cannot answer that, because I do not have a crystal ball, but in this post I want to instead look at the performance of individual shares over the past 12 months.
The intention of this post is to look at the individual holdings that make up the ASX:200 index and compare their performance to the A200 ETF as a whole. I am curious at how many individual holdings would have “outperformed” the Index in terms of returns over the past 12 months.
A200 Return
First, we will start with a basis of what we will be comparing the individual holdings to.
A200 – Price 14/7/2020: $99.35
A200 – Price 13/7/2021: $123.73
Return of 24.54% (told you it was a cracking year)
Individual Holding Performances
I was a little surprised at the results to be honest, I had initially expected only a small portion of the A200 ETF to perform really well, with a lot of mediocre performances. However, I was incorrect, and it appears that the majority of shares had actually outperformed the A200 ETF over the 12-month period.
| Total Outperform | 101 |
| Total Underperform | 97 |
| Total New Listings | 2 |
So that was my first surprise, where 101 out of 200 of the listings actually outperformed the A200 ETF over the period. Only 97 of the listings actually underperformed the A200 ETF over the same period, and 2 listings were not around 12 months ago so there was no data available to compare.
Performance Breakdown
The below chart provides a breakdown of the number of listings in each performance bracket.
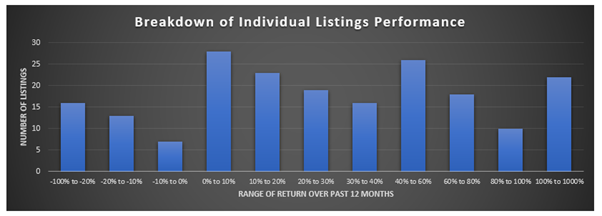
As you can see, the vast majority of listings had positive returns over the past 12 months. 162 out of 198 companies went up, which is impressive really. A substantial number of companies actually had returns greater than 100%, 22 in all actually doubled in value over the past 12 months.
Undeserved Confidence
One of my main concerns with data such as this, and it is relevant in my situation as I only started investing in shares in April 2020 (good time to start I know), is that particularly over the last 12 months, with returns being so substantial across the board, one might garner a significant level of confidence from their returns over this time period.
Let’s say you call a “success” a listing which returns over 10% for the year, then there were 134 out of 198 listings which gave you a successful return. Even if you just picked companies at random from the ASX200, then you would still have a 68% chance of being successful.
I feel this could give someone, who is potentially not as educated as they should be, some undeserved confidence with investing as they might think it is an easy game and they could easily become more of a trader rather than an investor, and make a better return that way.
Previous Years
Because the past 12-months seemed like such an outlier in terms of results, I want to look at a few other recent years to determine what the results actually look like.
I will look at the previous 2 years, but I will be a bit lazy and use the same companies from the current A200 basket of holdings. I would have liked to have gone back longer but the A200 ETF has only been around since 2018. One day if I have more time I may go back further with a different ETF.
2019 to 2020
A200 – Price 15/7/2019: $111.24
A200 – Price 13/7/2020: $99.98
Return of -10.12%
| Total Outperform | 99 |
| Total Underperform | 95 |
| Total New Listings | 6 |
Again, it seems to provide similar to current results where the majority of shares to outperform the entire ETF.
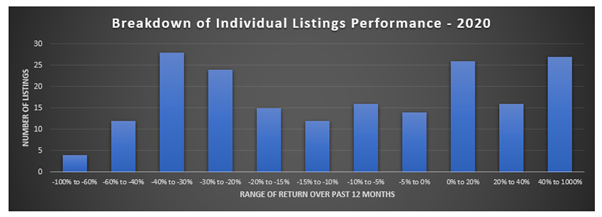
Given the fairly lacklustre year it is no surprise that a lot shares performed poorly and provided a negative return. Only 69 out of 194 listings actually provided a positive result, it definitely wouldn’t have allowed for undeserved confidence as there would have been a lot of people who invested in good companies who still had a negative return.
2018 to 2019
A200 – Price 13/7/2018: $103.91
A200 – Price 15/7/2019: $111.24
Return of 7.05%
| Total Outperform | 92 |
| Total Underperform | 98 |
| Total New Listings | 10 |
This year is different to the other two in that the majority of listings actually underperformed the ETF as a whole. That being said, however, it is still fairly close to a 50/50 split of companies that underperform or outperform.
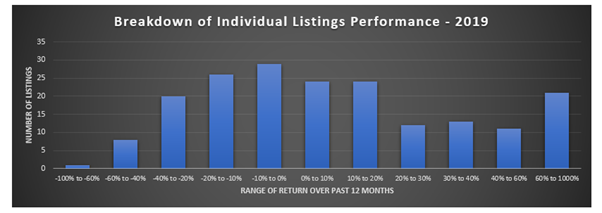
Although the majority of companies (105 out of 189) provided a positive return, there is still a significant risk of returning a negative return for the year as there are a substantial number of companies which returned just under 0.00%.
Summary
If you are able to research successfully and pick individual companies that outperform the index, then it can definitely be profitable. The only problem is, it can be difficult/impossible to pick winners before they actually become winners.
Over the last couple of years, it looks like there is roughly a 50% chance of picking a company at random which will outperform the overall index, or conversely, will underperform the index.
I still believe in the end you are better suited to just stick with index investing, as it is the most reliable way to invest successfully in the stock market. Not only is it the most reliable way, it is also the easiest way to invest as it involves the least amount of research.