Impact of Missing the Best (and Worst) Days on the Stock Market
It is never a good feeling looking at your portfolio after a bad day, I am fortunate enough that I am still yet to experience a REALLY bad day. So far, the worst I think I have seen is around -4.00% in a day, and just recently I almost experienced the first time I would have lost over $10,000 in a single day. It is a pretty crazy feeling, that almost 10 weeks’ worth of wages, lost in the market, just like that.
On the other side of the coin are the days when there is a booming day in the market, and you see your portfolio rise dramatically, and now you are just hoping the gravy train never ends.
It is important to not allow these swings to affect your emotions, and you need to be mentally strong to be able to maintain your investing plan through thick and thin. The moment you try to time the market, or become affected by it, whether than be too scared to invest in a falling market, it is normally a time when you will negatively impact your overall returns.
The bottom line is, nobody can predict what the market is going to do tomorrow, it may have gone down 5.00% today, and tomorrow it might go up 10.00%, or it might go down another 5.00%, it really is impossible to tell and anyone who is telling you otherwise is trying to fool you.
In this post I want to look back at past performances, and show what your portfolio would look like if under the following scenarios:
- Base Case – Investing Regularly
- Removing the 10 Best Days
- Removing the 10 Worst Days
Methodology
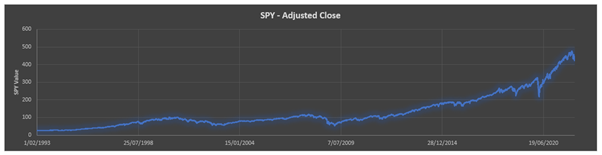
I will be using the historical data from SPY ETF for this exercise, mainly as it has the longest historical data available of any ETF that I have found. The ETF started in February 1993 so it has been around a long time and been through many ups and downs.
In each scenario I will be investing $3,000 at the start of each month.
Using the historical data, I will determine the 10 best and worst days in terms of % change from the previous day, and for Scenario 2 and 3 I will remove the Top 10 best and worst days respectively.
There is 7,320 days of data, with the top 10 representing approximately 0.14% of the days.
Results
Below is a graph of the SPY ETF since inception (1/2/1993) to today (24/2/2022)
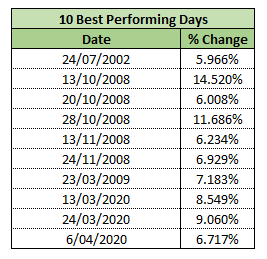
The Top 10 Best Performing Days are as follows:
The Top 10 Worst Performing Days are as follows:
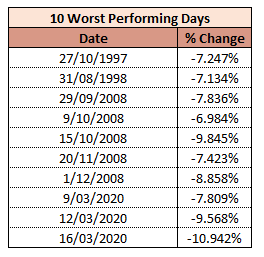
The first thing that jumps out to me at least is how a lot of the days from both tables are bunched with each other. The main culprits in terms of downturns and upturns occur around the 2008 GFC and the 2020 Covid Crash. This makes a lot of sense because there is a sudden loss of value in the market during the crash, but it is not representative of a drop in value of the companies on the share market, more just emotions in the downturn, so it is understandable that there would be a sizeable recovery around the same period.
Returns
Below is a table summary of the approximate value of each portfolio from today’s perspective.
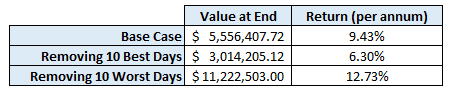
As you can see there is a significant difference between each of the portfolios and removing just 0.14% of the days can have dramatic impacts on the overall returns.
The total amount invested in this exercise totalled $1,047,000.00.
As you can see there is a risk if you do try and time the market, obviously if you time it well and miss some of the worst days, it can really help save your portfolio, but if it happens to be a booming day that you miss, it can really diminish your returns.
Below is a graphical representation of the return over time.
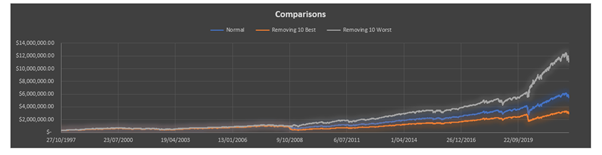
There is not too much exciting in this graph, you can see they really started to diverge around the GFC when there was a lot of movement in the market. The next significant divergence was around the Covid Crash when there were some big losses and big gains.
Conclusion
I still believe that if you are trying to time the market, then you are really running a significant risk. The market is too unpredictable and too often it can come back to hurt you if you do try and play those sorts of games.
For example, if you look at the worst days, you can see the market dropped significantly on 29/9/2008, 9/10/2008 and 15/10/2008. It could be easy to predict that the market might continue to keep dropping in a regular pattern, so you decide to sell your shares, expecting to buy mid-November when they are at a rock bottom price. Except you miss out on the massive gains on 20/10/2008 and 28/10/2008.
If I went through the data in more detail and decided to look at the top 50 best and worst days, then there would be a lot more examples, but I think you get the picture. You may get lucky and miss out on some of the bad days, but chances are you will miss out on some of the great days as well, and in the end you will probably end up back where you were, only having to have invested a lot more time and effort to buy/sell shares in a moving market.