How to Watch Out for Sequencing Risk – Part 2
In a previous post located HERE, I talked about the basics of what Sequencing Risk is and how it can have significant impacts on investments. That post went through theoretical examples and ups and downs, but I wanted to have a look at results based on real historical data to see what sort of real-life implications sequencing risk could have as part of the FIRE strategy.
For this spreadsheet, I used the S&P 500 Index, which tracks the top 500 US Companies. This Index only has historical data back to February 1982, so I only had 39 years’ worth of data. This was not enough for the purposes of this exercise, but since I am only trying to forecast a realistic scenario, I just replicated the % returns when the historical data ended and then cycled back through the data again.
If I did look hard enough, I am sure I would be able to find a nice dataset that would extend for up to 100 years, but I think for the purposes of this exercise, this dataset I used is sufficient. All I am trying to do is highlight exactly how sequencing risk could impact a realistic scenario, which this dataset is able to provide.
How the Spreadsheet Works
In this spreadsheet, I created 77 simulations, 6 months apart through the Pre-FIRE and Post-FIRE stages. With identical deposits, FIRE number and withdrawals (inflation adjusted). With these simulations, I can look at how successful or unsuccessful a specific starting point might be.
For this spreadsheet I used the following inputs:
Monthly Deposit – $5,000 (in 1982 Dollars)
FIRE Target – $800,000 (in 1982 Dollars)
Annual Retirement Expenses – $36,000.00 (in 1982 Dollars – This is a 4.5% withdrawal rate)
Inflation Rate – 2% per annum
I used a 4.5% withdrawal rate rather than the rule of thumb 4.00% withdrawal rate because I wanted to have a higher risk of “failure” so I could have a look at the impacts of sequencing risk.
Example Simulations
With the above inputs, I will show you the financial position if the FIRE journey started on 1/2/1983:
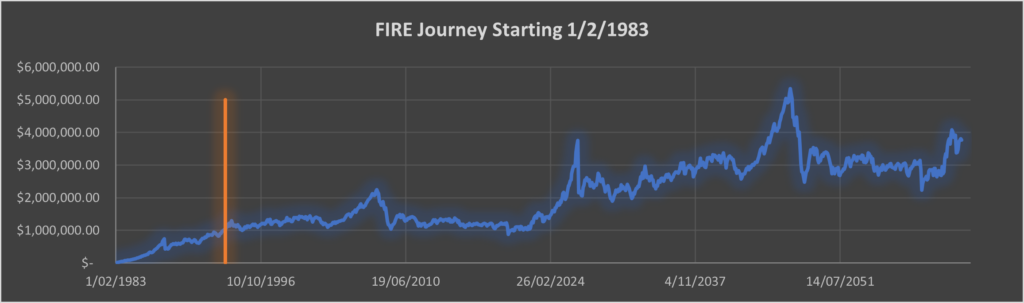
The Orange line represents when Post-FIRE started, as you can see it was fairly rapid and the sequencing of returns worked in our favour and we had a long and prosperous retirement.
In this example, it took 10.33 years to reach FIRE, and after 70 years of retirement the portfolio was still worth almost $4,000,000.00.
This is an example of a “successful” FIRE journey, but there are a handful of examples where FIRE was less than successful.
Failed Example
The following tracks the financial position if the FIRE journey started 1/2/1982 (just 12 months earlier than the previous example)
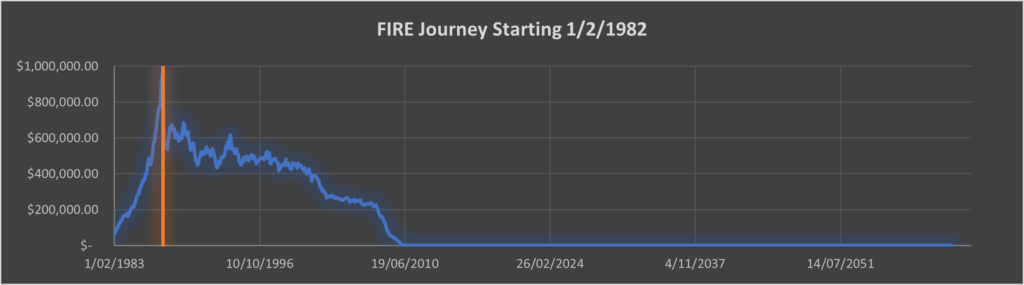
As you can see in this example, we took a much different trajectory with our FIRE journey. Even though it was only 12 months earlier than the successful journey, this one destroyed us very quickly.
It might be hard to see on the graph, but you really could not pick a worst time for a FIRE journey to start, there was a massive 42% drop in the market literally 1 month after FIRE starting. Unfortunately, from this moment we were doomed to fail, and we would never succeed (without altering our FIRE plan).
It should be noted however, that with this FIRE Journey, we were able to reach FIRE in 5.58 Years. There were some significant gains leading towards the end of our accumulation, so we reached our FIRE number rather quickly. Whereas if we started 12 months later, we had to accumulate through the 42% drop in the market, and it took us almost 5 years to recover and reach our own FIRE (but given the result I think I would be fine with waiting another 5 years given the successful retirement).
Results
The below graph shows the share value over time, and the vertical lines indicate a FIRE start date that WAS NOT successful. For the purposes of this I have deemed an unsuccessful FIRE as not lasting 40 years of retirement. All up there were 16 instances (out of 77) that were unsuccessful.
Also please note, that the vertical lines correspond to when Post-FIRE started, not right at the start of accummulation.
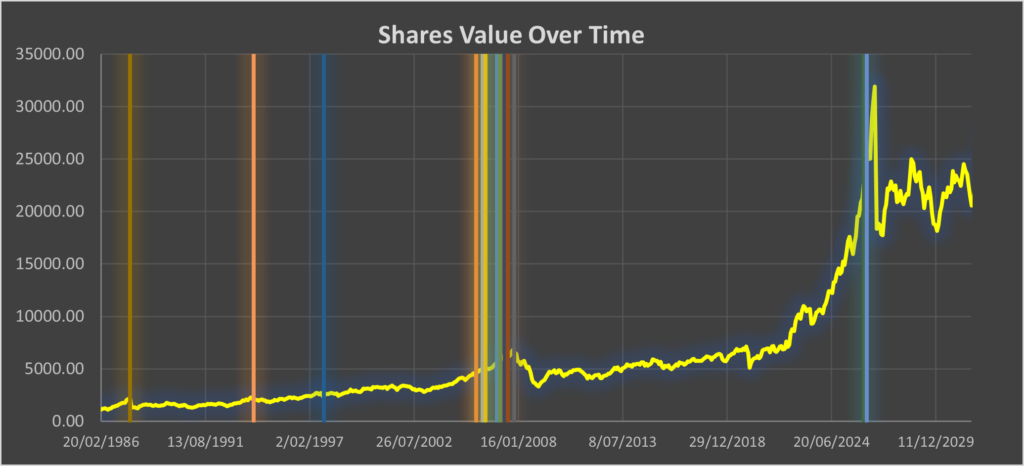
The first vertical line on the graph above indicates failed example of FIRE starting at 1/9/1987.
The two “failed” FIRE simulations at the end of the graph above, these actually corresponds to the same drop that was experienced in October 1987. Remember how I said I just used the same returns starting out again for future data, this has looped back around for a second time. There would have been earlier and later failed ones due to the same drop in the market, however this was the start and finish point of my simulations.
As you can also see, there are a lot of “failed” FIRE simulations between September 2005 and November 2007. This was due to the global financial crisis which caused such a significant drop in the market, as well as taking a long time to recover.
I thought there may have been a failed FIRE simulation due to the crash we experienced around March last year. You can see a little drop in the market price around that time, but I think because there was such a rapid recovery (less than 12 months) it did not have too much of an impact on people who started FIRE around this time. In fact, for someone who started FIRE on 1/3/2020 (just before the crash), they were able to finish the simulation after 69 years of retirement with a substantial balance remaining. Their balance did drop by $1.7m down to $1.2m during the crash, but recovered quickly.
Peculiarity
While looking at the results, I did notice something rather peculiar however, the failed FIRE simulations where FIRE started 1/11/1997 and 1/3/1994 . I could not really see a reason why these particular simulations did fail. All of the other instances had a big drop in the market within 5 years of the FIRE date, but that was not the case with either of these simulations. It should be noted that both FIREs did still last over 36 years, so somewhat significant, but still “failed” simulations, nonetheless.
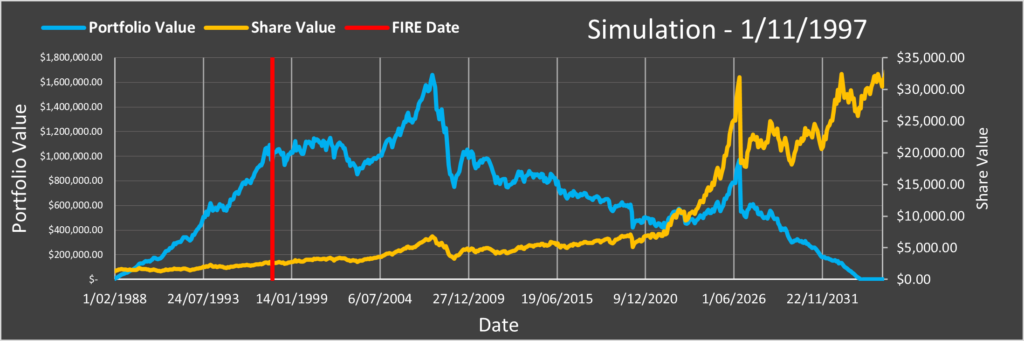
The graphs below shows the value of the portfolio for each simulation over time, and I have also overlaid the share value as well to see if there are any sort of obvious reasons why it may have happened.
Simulation 1/11/1997
Simulation 1/3/1994
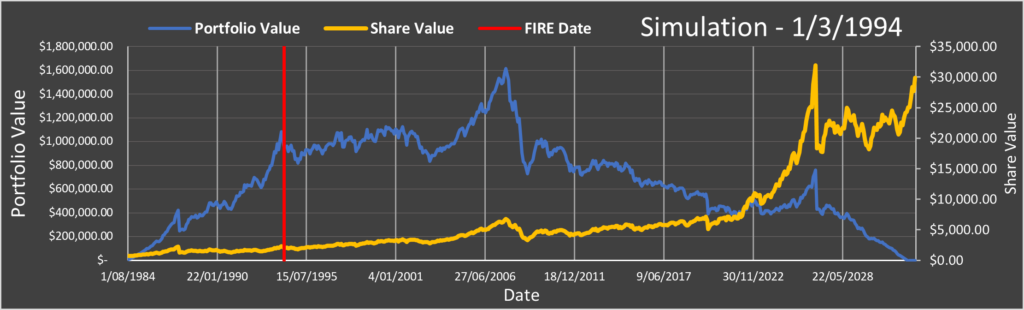
Looking at the results on the above graphs, it still is not directly obvious why both simulations did “FAIL”.
In both instances, there were mediocre return for several years after reaching FIRE (indicated by the Red Line), then although there was good growth for a following 5 years, both simulations were significantly diminished out by the GFC crash in 2008.
Both simulations recovered, slowly, but then they were also impacted by the Covid crash, before being finally wiped out with the “1987/2026” Crash.
It seems there just was not enough growth in the first few years post FIRE to build up a portfolio significant enough to be able to deal with the crashes that were going to come.
I should also mention, that the vast majority of simulations either side of these “Failed” simulations, had the FIRE duration between 40 – 55 years. So while only these two particular cases did fail, it was still a poor period in general for other simulations as they did not last a great deal longer either.
Further Results – Accumulation
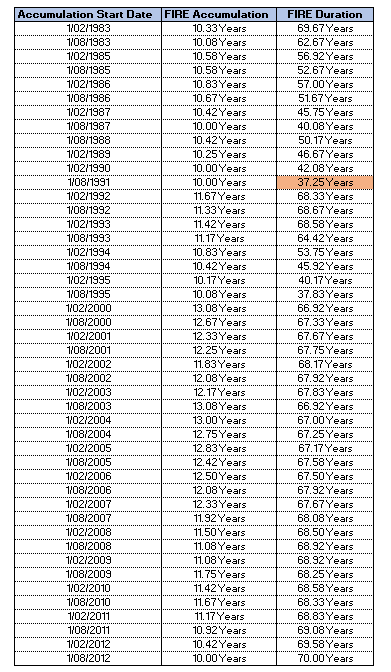
Another result of sequencing risk that can impact our FIRE journey, is how long our accumulation (or Pre-FIRE) is expected to be. From the results of these simulations, the minimum duration was 5.58 years, with the maximum duration 13.08 years – that is a massive 7.5 years difference between the slowest and quickest, while keeping all the other parameters the same.
The average duration to accumulate funds was 10.23 years. The distribution of each result looked like this.
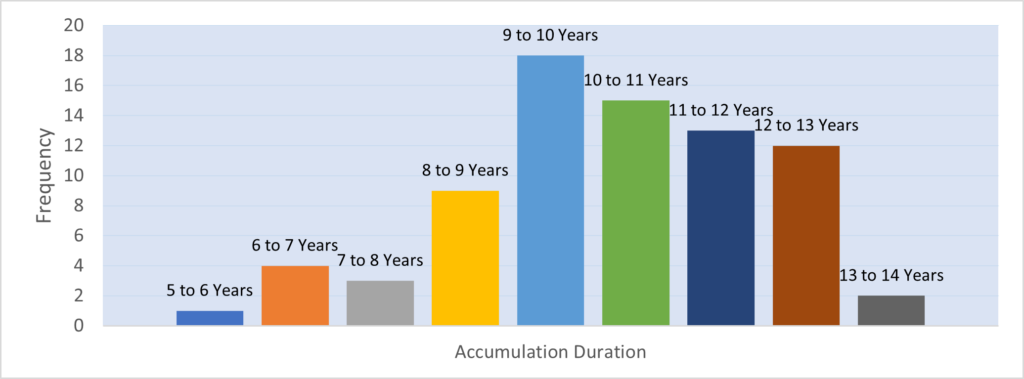
You can see in the above graph that the most frequent result is somewhere around 9-10 Years to reach FIRE, with results ranging from 10-13 Years also likely. Definitely a significant skew to the longer durations to reach FIRE.
However, in my opinion the accumulation portion is not as important as the Post-FIRE phase, this is where things could become incredibly dire if sequencing risk goes against you.
Further Results – Post-FIRE
I have talked about the simulations which “Failed” – that is, they did not last greater than 40 years. A lot of this will depend on your retirement date as to how long you need for your FIRE to be deemed a “success”.
The shortest FIRE time that was achieved was 16.67 years (in this simulation, FIRE started right at the start of the GFC, basically the worst possible time given the significance of the crash and the slow recovery afterwards)
Several of the FIRE simulations reached the end of the simulation (80 years from the start of accumulation) with funds remaining. 41 out of the 77 simulations reached this, typically around a 70-year retirement.
Below is a frequency distribution table of the Post-FIRE results
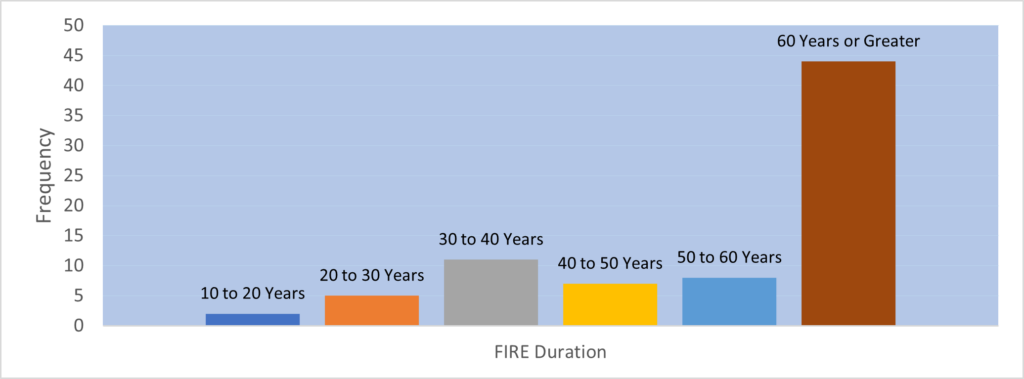
In most of the situations (57% – 44 out of 77), your FIRE amount will last for over 60 years. Even if you retire in your 30s, there is a 57% chance that you will have sufficient funds to last until you pass away.
However, 57% really is not that high a number, and the last thing you want is to run out of money in your retirement. Remember however, that I did use a 4.5% withdrawal rate, if you reduced this number down to the rule of thumb 4.00%, then this number will increase to 80.5% (62 out of 77 simulations).
Correlation Between Short Accumulation and Short FIRE Duration?
This was not something I had expected to find out when I first started out this exercise, but it does appear there could potentially be a bit of a correlation between a short accumulation phase and a short FIRE duration. My only assumption might be that it is because typically before there is a crash, there is a bubble with significant increases in stock value. I believe that due to this significant increase, there is an increased chance of prematurely reaching your FIRE target, and then ultimately running straight into a crash once you are post FIRE.
There were 17 instances where the accumulation phase took 9 Years or less. Of these, 7 failed to reach FIRE for 40 years. This is a failure rate of 41.18%, compared with a failure rate of 22.08% for the complete dataset.
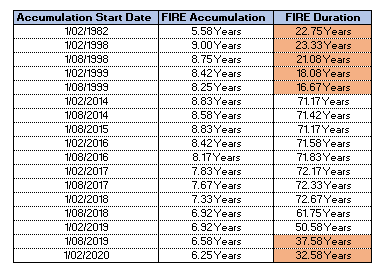
Conversely, if you have an accumulation duration equal to or greater than 10 years, your FIRE failure rate decreases significantly down to 2.17% (1 out of 46)
Again, I am only speculating as to the reason why a shorter duration during the accumulation phase does seem to result in a significantly higher failure rate, I just found it interesting to point out.
One way to mitigate against potential failure down the line may be to increase your accumulation duration by about 20% to give you an extra bit of confidence. This is all dependent on your personal FIRE journey of course. If your accumulation phase took 15 years for example, this might mean accumulating for an additional 3 years before you finally pull the trigger and hit FIRE. It might seem excessive, working an extra 3 years, but if you really want that additional confidence to be able to last the rest of your life with your investments, it might be 3 years well spent.
How Else Can We Mitigate the Risk?
I just talked about one way to mitigate risk when it comes to sequencing of returns (working longer) but of course there are other ways. In all the cases in which FIRE “failed”, there was either mediocre returns for a significant period of time, or a large crash within 5 years of starting FIRE.
I think it is great news that the majority of “failures” occurred so close to our FIRE date, it means it is not the end of the world if we do have to go back to work for a bit longer. We have typically not been out of the workforce too long; our skills have not diminished too much, and we should be at a relatively young age. Going back to work is not ideal, but if it is the difference between a long and prosperous retirement and running out of money with several years to decades of life left, I know what option I would rather choose.
As I have also said many times in previous posts, being flexible is incredibly important. If you do run into a crash during FIRE (which I can almost guarantee will happen at some point), then you might need to change your spending habits, maybe spend substantially less for a year or two while the market recovers. You might need to work on generating a side income to supplement your lost earnings from shares. The 4% rule (or 4.5% or 3.5% or whatever you want to use) can not be a hard and fast rule, you need to be flexible and able to adapt with the changes that come.
Conclusion
I hope you have enjoyed reading this as much as I enjoyed writing it. I learnt a whole lot more about how sequencing risk works after going through it myself and seeing real life situations on how it can impact FIRE.
I do need to mention that obviously this was just using returns from the S&P 500, and most likely while you were in FIRE you might have some defensive assets (bonds etc) as part of your portfolio, whereas this example was pure equities. Due to this, crashes were more significant and hit harder, which may have caused a higher failure rate of FIRE.
In another post I will talk about how I will be optimising my portfolio to best deal with an unknown future and how to deal with a long duration of FIRE.
Loved this post!! Very interesting read. Your speculation around a quick FIRE having a higher failure rate due to a bubble before a crash makes sense to me too.