Flexibility With Safe Withdrawal Rate
Talking about Safe Withdrawal Rates (SWR) is always a contentious issue within the FIRE community. The majority of people fall into the “4% Rule of Thumb” category, and while I believe this is a great place to start, there are so many variables that need to be considered to be able to come up with a more appropriate SWR.
I will not get into that discussion today, but in this post I wanted to look at how being flexible with SWRs may be necessary once you reach FIRE if you want to be able to reliably navigate your way through retirement. One of the worst things I can imagine would be reaching an age of 80 or so and having my portfolio running out, leaving me to rely on the charity of others or the government for support, while it would not be the end of the world, it is definitely not something I would like to have happen to me.
How To Lower Risk with SWR
The most obvious example of lowering your risk in retirement, is to simply lower your SWR. If you lower your SWR down to 3.00%, you will have significantly increased your chances of having a “successful” FIRE.
The only issue with this option is that the lower risk comes attached to additional work. Imagine you want to live off $40,000 per year, if you use 4.00% as your SWR, then you need a portfolio of $1,000,000 to withdraw from. If you lower your SWR to 3.00%, to live off $40,000 per year, now you will need to start with $1,333,333 instead. An additional $333k will need to be accumulated prior to retirement.
This may work for you, but if you are in a rush to reach FIRE, then the prospect of working an extra few years might seem daunting, especially when you know you could practically just pull the trigger already and FIRE with over a million in the portfolio.
Flexible SWR
I have talked about this in a few posts, and I believe the most important factor that comes with a successful FIRE is being flexible. There may always be instances where you will need to reduce your spending to get you through tougher times. I have talked before about Sequencing Risk and how this can significantly affect how successful your FIRE will be.
In this post I will explore about how even if you do run into significant issues with sequencing risk, some options you may have to navigate your way out and back onto the path to success.
FIRE Projections
Sequencing Risk typically comes into play when there is a significant drop in the market within the first few years of our Post-FIRE life. We will have our large pool of wealth sitting there, only for it to be eaten into drastically and reduced to a fraction of what we would prefer to have. The below is an example of what I am talking about:
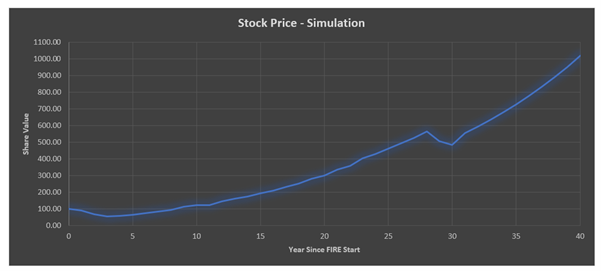
The above is just a simulation of the share value over time, right as we do reach FIRE, there is a significant drop in the market and it takes almost 9 years to recover back to the original value. I want to now look at how this would impact a real case scenario of someone who used the 4.00% rule, allowing for a 2.00% inflation rate for expenses.
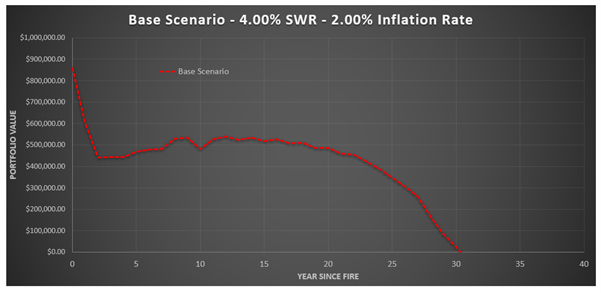
As you can see, although the drop in the market looks relatively small on the first graph, it wipes out over half of our capital right away, and since our withdrawal amount did not change since the start, instead of withdrawing 4.00%, we were effectively withdrawing over 8.00% (now that our capital is halved, our SWR has now doubled).
Even with the market showing significant signs of improvement after the downturn, our portfolio was never able to recover, and our FIRE ended prematurely. I will note that this FIRE still did last over 30 years, so according to the Trinity Study, it would have been deemed a success, but I am looking at reaching 40 years to allow for a longer retirement timeframe.
Adjusting SWR
It stands to reason, that if you reduce the amount you withdraw, the longer your money will last. I want to look at now how much and for how long you might need to reduce that amount you do withdraw.
In the next graph I will model, using the same stock value as earlier, the following parameters.
- Reducing SWR by 10% for 3 Years
- Reducing SWR by 10% for 5 Years
- Reducing SWR by 10% for 10 Years
- Reducing SWR by 30% for 3 Years
- Reducing SWR by 30% for 5 Years
- Reducing SWR by 30% for 10 Years
- Reducing SWR by 50% for 3 Years
- Reducing SWR by 50% for 5 Years
- Reducing SWR by 50% for 10 Years
To reduce SWR by 10%, instead of withdrawing $40,000 for expenses, instead it will only withdraw $36,000. This does not mean that you would necessarily need to live on less money, as there is always the option to earn money elsewhere, and I believe that would be a more likely option, particularly for the higher reductions amounts (it might be difficult to live on $20,000 for 10 years if you budgeted for $40,000 for example).
Below is a graph of how all the different simulations panned out throughout the retirement period.
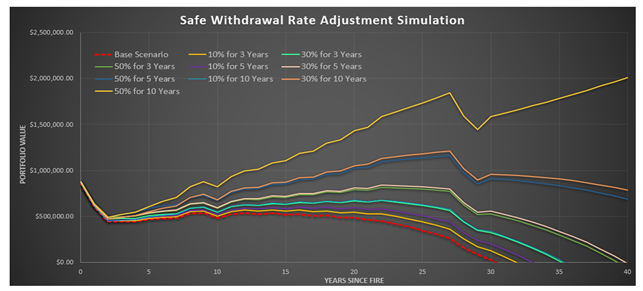
As you can see, we still had some failures, but there was a significant improvement even by making relatively minor changes to our SWR. A summary of the outcomes for each simulation is as follows:
- Base Scenario: Failed after 31 Years
- 10% for 3 Years: Failed after 32 Years
- 10% for 5 Years: Failed after 34 Years
- 10% for 10 Years: Failed after 37 Years
- 30% for 3 Years: Failed after 36 Years
- 30% for 5 Years: Failed after 39 Years
- 30% for 10 Years: Success
- 50% for 3 Years: Failed after 39 Years
- 50% for 5 Years: Success
- 50% for 10 Years: Success
This simulation was a pretty significant crash in the market, and it did take some drastic measures to be able to recover successfully.
Reducing our SWR by 50% for 5 years was just about the minimum we had to do to ensure we had a successful FIRE. This means effectively, we had to either reduce our spending by $20,000 or earn an additional $20,000 (or a combination of both) every year for 5 years.
Although it might sound like a drastic move to need to do, if it is the difference between a successful FIRE or not, it would definitely be worth the effort in my opinion.
Real Life Simulations
Now I want to have a look at real life simulations, with more realistic returns and inflation rates. It is not as comprehensive as a lot of other simulations you can find, but my intention for this post is not to go into detail about predicting FIRE for people, more about just showing how you may need to be flexible with your SWR if you do run into some trouble, particularly early in your retirement.
The following uses the Australian Inflation Rate from 1923 – 2018, and the All Ordinaries Index from 1923 – 2018.
Again, I will be using a SWR of 4.00%, and starting with $1,000,000 with our expenses then adjusted due to real time inflation over time.
In this simulation, I am wanting to preserve the capital through the retirement, so a successful FIRE will be determined if we have our inflation adjusted capital remaining after 40 years.
The Simulations will take place annually from 1923 to 1979 (1979 is the last year I can use to still have 40 years’ worth of data up to my data limit of 2018)
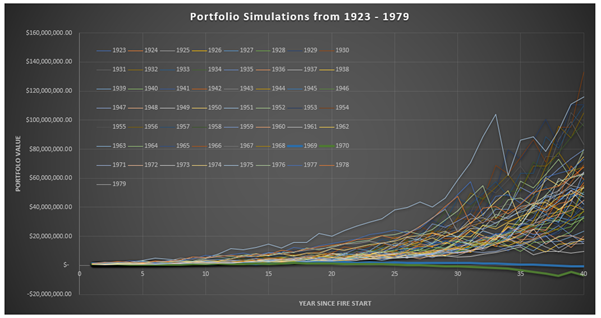
The graph above may look like a bit of a mess, and that is understandable, as there is a lot going on in that graph. As you can see, the vast majority of simulations are successful. In fact, only two simulations (1969 and 1970) failed out of a total of 57 simulations.
Below is a table summary of the results of the simulations:
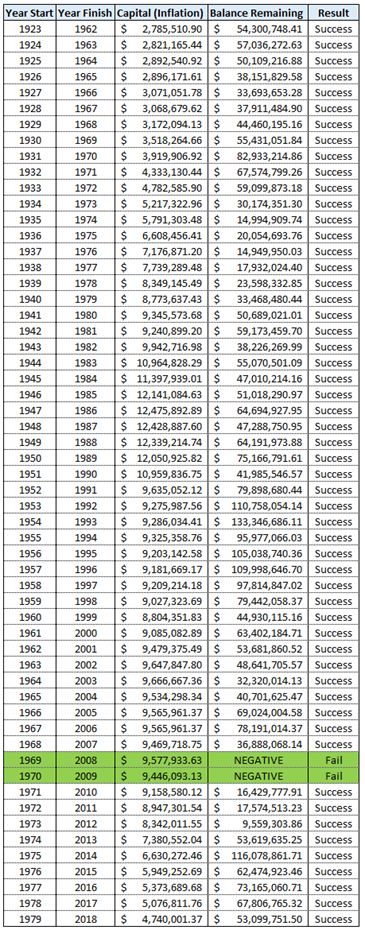
So, you could deem that a 96.5% success rate? And some of those portfolios were some serious wealth as well. In 1975 turning $1,000,000 into $116,000,000 over 40 years is crazy (even if it is only $17.5 million adjusted for inflation – still, I am sure the grandkids would not mind having that as their inheritance).
But in this post, I want to talk about how we can be flexible with our SWR and turn even these “failed” simulations into “successful” retirements.
Closer Look at 1969 and 1970
Below is the graph with only 1969 and 1970 shown, with a more appropriate scale it might be able to have a good look at what actually happened and why they did fail.
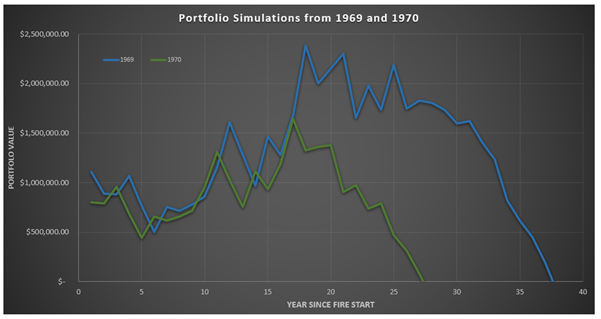
Given the close proximity of each simulation, they both ran into the same issues with poor returns early in the retirement phase.
Below is a summary of the All Ords Return and Inflation Levels between 1969 and 2009:
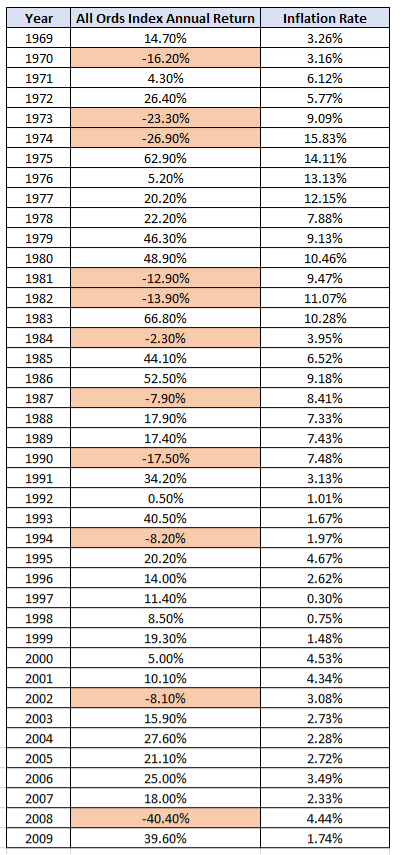
The above table shows a significant downturn in the market within the first 6 years of each simulation, as you can see in the 1969 and 1970 graph above, each portfolio dropped by over 50% in this period. High levels of inflation did not help, and even with some significant gains in the stock market, it was not enough for the simulations to recover to make it through retirement.
It should be noted however, that even in a particularly bad scenario, in 1969 it still lasted over 36 years, which is still a decent length retirement.
Adjusting SWR for 1969
In the next series of graphs, I will reduce the SWR by 10%, 30%, 50% and 70% over durations between 1-10 years.
I still have a requirement to have capital preserved by the end of the 40-year period to be determined successful. I will also include a line on the graph which will show the initial capital (inflated) so it can be determined if it is “successful” or not.
Given there are also multiple years early on where there are significant downturns, the following years will be reduced under the following scenarios:
- 1 Year: 1970, 1973 – 1974
- 2 Years: 1970 – 1971, 1973 – 1975
- 3 Years: 1970 – 1976
- 4 Years: 1970 – 1977
- 5 Years: 1970 – 1978
- 6 Years: 1970 – 1979
- 7 Years: 1970 – 1980
- 8 Years: 1970 – 1981
- 9 Years: 1970 – 1982
- 10 Years: 1970 – 1983
1969 – Reducing SWR by 10%
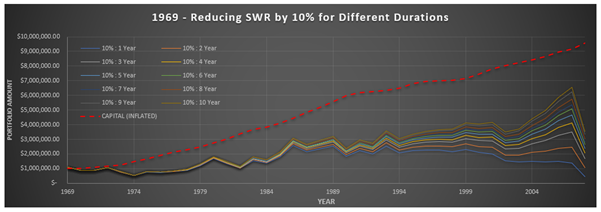
While there are no “successful” results, at least by even reducing the SWR by 10% for 1 year does allow us to not deplete all our capital at the end of our 40-year period.
1969 – Reducing SWR by 30%
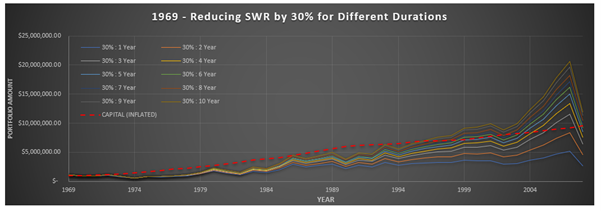
Finally, we start to see some “successful” retirements, with all times when SWR was reduced for 30% for at least 7 years we succeeded. It might be worth noting however that the large 40% drop in 2007 is really not helping.
1969 – Reducing SWR by 50%
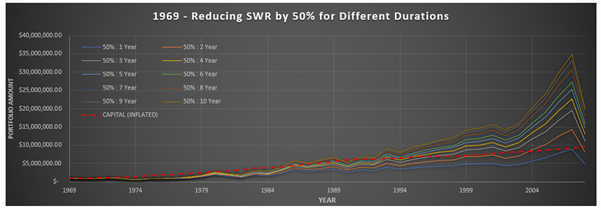
Now we only have two scenarios where our retirement “fails”, as long as we reduced our SWR by 50% for at least 3 years we will have “success.”
1969 – Reducing SWR by 70%
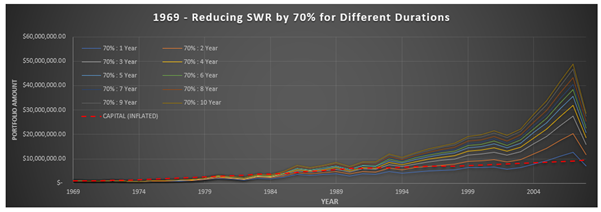
Similar to before but now we only have one “fail” in our simulations.
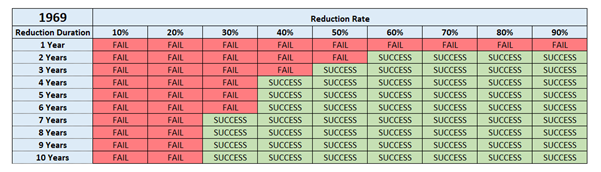
A summary of the results is in the following table, which includes different reduction rates:
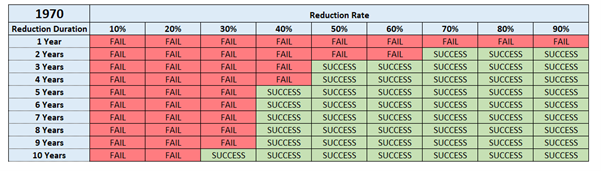
Adjusting SWR for 1970
I will now go through the same process for our 1970 scenario.
Given there are also multiple years early on where there are significant downturns, the following years will be reduced under the following scenarios:
- 1 Year: 1970, 1973 – 1974
- 2 Years: 1970 – 1971, 1973 – 1975
- 3 Years: 1970 – 1976
- 4 Years: 1970 – 1977
- 5 Years: 1970 – 1978
- 6 Years: 1970 – 1979
- 7 Years: 1970 – 1980
- 8 Years: 1970 – 1981
- 9 Years: 1970 – 1982
- 10 Years: 1970 – 1983
This one will require a much more drastic action as it failed significantly earlier than 1969. After only approximately 27 years.
1970 – Reducing SWR by 10%
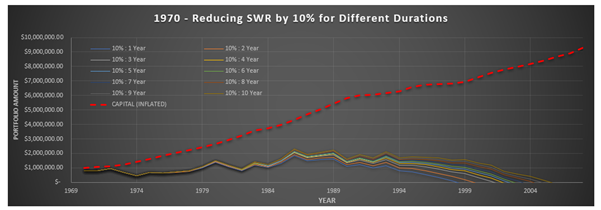
As you can see, this is still a significant failure. Even by reducing our SWR by 10% for 10 years we still deplete all of our capital prior to reaching 40 years.
1970 – Reducing SWR by 30%
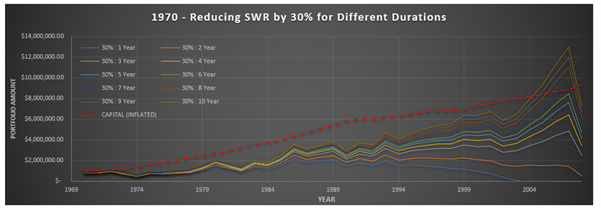
While we do not have any “successful” retirements, at least we only have one simulation which now depletes all the capital before the end of the 40-year duration.
1970 – Reducing SWR by 50%
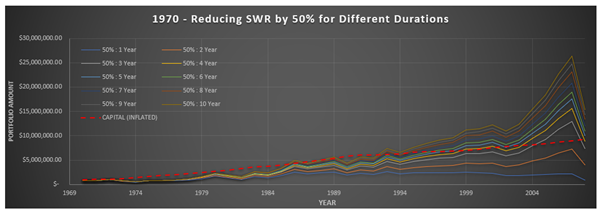
Finally, we have some “successful” retirements, although it does take reducing our SWR by 50% for at least 5 years, which is definitely quite drastic.
1970 – Reducing SWR by 70%
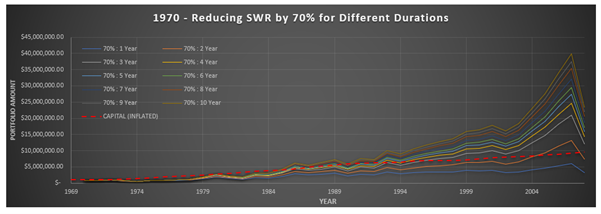
Similar to before but now we only have two “fails” in our simulations.
A summary of the results is in the following table, which includes different reduction rates:
Discussion
I believe one key takeaway from the above results is that the duration you will need to be flexible for with regards to your SWR will be a lot more significant than I would have initially assumed.
If there was a bad year in the returns, I would have assumed I could reduce my SWR just for that year and it should be able to recover. But as you can see in the tables above, even if you reduce your SWR by 90% for only one year, in these simulations it will still show as a fail.
A lot of it will depend on the recovery of the market of course, in the case of 1969 and 1970, it took around 7 years to just recover back to the original peak levels before the downturn, that is not even accounting for inflation.
Summary
The key problem to all the above analysis is that it is all done retrospectively, it is obviously very easy to be able to look back at past data, modify the variable at the time and ensure you will have the results that suit by the end of our retirement.
What do we do while we are living through a crash at the start of our retirement though? Do we reduce our SWR by 30%? Or 50%? And for how long do we do it? 3 years? 10 years? These are all questions that I do not know the answer to.
I might try and look for myself to see if I can come up with some sort of guide based on how much of a downturn it has been and how long the recovery will be. I assume there might be some sort of formula or guide that can be created using those two inputs.
There is always the option be a bit more risk averse and take different approaches, move some of your portfolio into bonds or other lower risk asset classes, or simply lower your SWR down to around 3.00% instead of 4.00%. Just for knowledge, 1969 and 1970 both had successful retirements when the SWR was 3.00% instead.
If you were prepared to work for an extra couple of years just to have that extra level of security, then lowering your SWR is definitely an option, but if you were looking to reach FIRE as soon as possible, then being flexible with your SWR through the downturns, particularly early on, might be critical for your long-term prosperity.