FIRE Date Calulator Spreadsheet
Access to the spreadsheet is located HERE
As you may be able to tell by now, I really enjoy a good spreadsheet. I like the ability to be able to simulate scenarios into the future to be able to provide me with financial guidance on which scenario will provide the best financial result.
Once I was completely on board with the FIRE journey, I figured I may as well do something similar for figuring out when my FIRE date will be – that is, what date can I theoretically retire and live off my passive income producing assets for the rest of my life.
Finding/Building the Spreadsheet
I did have a look around to see if there was a spreadsheet already available online to suit me (no point reinventing the wheel, right?) and the closest I got was this one located HERE on the Aussie Firebug website. AFB writes a terrific blog and also has a really great Podcast, and while I did gain a lot of inspiration from the spreadsheet he provided, there were a couple changes I wanted to make.
Normally I do prefer to make a spreadsheet myself anyway, because by building a spreadsheet it gives me an understanding of what each specific cell is actually calculating, and how the result actually comes to fruition. A lot of the time I use other people’s spreadsheet, particularly if they hide formulas on cells, I do end up asking myself “where did that number come from?” quite a bit, and specifically if I do share something on my own Blog, then I want to know all the ins and outs associated with it.
I knew what I wanted the spreadsheet to do, now I just needed to figure out how to make it automated based on a few inputs. I guess this is where the fun begins!
Spreadsheet Inputs
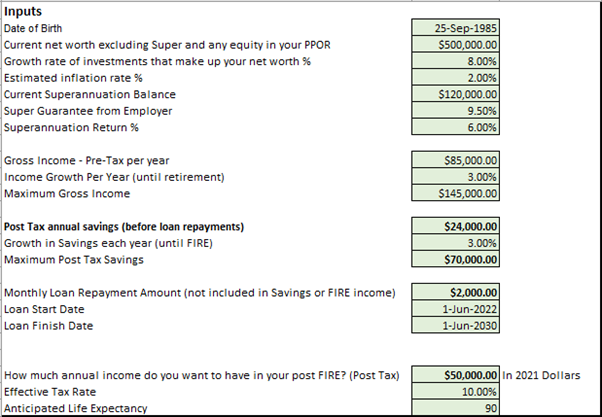
When building a spreadsheet, I try to minimise the number of inputs as much as possible. And I was able to get this spreadsheet down to “just” 19 individual inputs. It may still sound like a lot, but I also wanted the spreadsheet to be able to provide as much flexibility as possible so it would hopefully be able to provide as much accuracy as possible. I will go through a list of all the inputs and explain why I believe each of them needs to be there.
Date of Birth – The spreadsheet calculates your age at FIRE, as well as your super preservation age so it stands to reason that your date of birth is required.
Current Net Worth excluding Superannuation and PPOR Equity – This number only includes your income producing assets (and your Superannuation will be covered on a separate input). If you did rent out a room or two in your PPOR, then it might become a little more difficult to calculate, but just use the growth rate to calculate an equivalent asset value.
Growth Rate of Investments that make up your net worth % – This is one of the biggest parts where you need to try and “predict” or “estimate” future returns. Inflation will be considered in a separate input, so you do not need to incorporate that number into this input. This number could vary considerably depending on which asset class you are using for your investments.
Estimated Inflation Rate % – Again this is where you need to predict or estimate what will happen in the future.
Current Superannuation Balance – Straight forward enough I would hope, just look up your current superannuation figure and input it here.
Superannuation Guarantee from Employer – As I write this it is typically around 9.50%, but it is increasing in the future, or some people maybe have a different arrangement with their employer where the employer contributes more into their Superannuation. NOTE: This spreadsheet does not consider additional voluntary contributions, so if you want to incorporate additional money going into your Superannuation you will need to amend this input to suit.
Superannuation Return % – This is the same as growth rate for your investments but specific to your Superannuation. I like to have a different growth rate for superannuation in case you have a higher or lower risk portfolio within your superannuation.
Gross Income – Pre-Tax per year – This can be individual or household, however you are working towards FIRE.
Income Growth Per Year (until retirement) – This is an estimation and will be difficult to calculate given your current experience and what industry you are working in. Also, this input only allows for a standard increase every year, even though realistically it might be more realistic to have larger increases earlier on in a career as your income starts to plateau towards the end.
Maximum Gross Income – To prevent income growing endlessly, this provides an income ceiling which may be dependent on your industry or what level you are aiming to reach.
Post Tax annual savings (before loan repayments) – This input is the number you realistically expect to be putting into income producing assets while you are still working. If you are making loan repayments, include your loan repayments (if applicable) in this input, as it will be removed based on another input later.
Growth in Savings Per Year (Until FIRE) – Similar to your gross income, this allows for an increase in your annual savings.
Maximum Post Tax Savings – Similar to gross income, this is your savings ceiling that may be reached while you are on the FIRE journey.
Monthly Loan Repayment Amount (not included in Savings or FIRE income) – This is an input I specifically wanted to put in because I did not see it covered in other spreadsheets. This allows for a time sensitive expense to be incorporated into your pre and/or post FIRE expenses. It does not specifically need to be for a loan repayment, it could be for any expense which adds to your standard expenses for a defined period.
Loan Start Date – You may not have a loan when you start this calculator, but you can input a future date (pre or post FIRE) when this regular expense will start.
Loan Finish Date – Input a date when you believe your regular expense will end. It can be pre or post FIRE.
How much annual income do you want to have in your post FIRE? (Post Tax) – This is another input I specifically wanted to put into this spreadsheet. The other spreadsheets I had seen assumed expenses pre-FIRE would be the same for post-FIRE as well. I did not like this approach as I plan on living a significantly different life once I am in post-FIRE, and it stands to reason that my expenses will be significantly different as well. This number is input in 2021 dollars and inflation is calculated for future years based on your earlier Inflation input.
Effective Tax Rate – Depending on how much you plan to live on post FIRE, you may have to pay income tax. I did not want the spreadsheet to automatically calculate tax as it would be overly complicated with franking credits, CGT exemptions and other deductions. I found it simplest and most effective to just allow people to input an effective tax rate they believe they will be paying based on their Post FIRE income.
Anticipated Life Expectancy – This spreadsheet assumes the optimised time to start FIRE where you can live the life you want and have money until you eventually pass away. Your life expectancy is needed to be put in to have an end date in the calculations when some money is required to be leftover in your investment portfolio.
Input Summary
Here is a summary of the inputs which I will be using for the future calculations (they are just random and do not represent any real-life scenario)
How Does This Spreadsheet Work?
I am not normally the best at explaining how I do things, but I will try my best.
The spreadsheet runs 240 different simulations based on the inputs above. The first simulation is starting FIRE immediately, the next simulation is starting FIRE in 1 months’ time, the third is starting FIRE in 2 months’ time – and so on until you have 20 years of simulations.
Each simulation runs until you reach your life expectancy and returns a total asset value when you reach this age. If the simulation has your FIRE date too early, then you finish with a negative number and hence FIRE will not be successful. Each subsequent simulation has you working for an extra month, not only building your portfolio slightly, but also meaning less time you need to survive on your existing investments.
As soon as you reach the first simulation where you reach your life expectancy with a total asset value greater than $0.00, this is your optimised time to start FIRE.
The spreadsheet also takes into account when you reach your preservation age, your Superannuation balance becomes accessible and is essentially added to your investment portfolio.
I hope that provides a basic summary of how the spreadsheet works. If you did have any questions, feel free to leave a comment and ask or send an email if you prefer privacy.
Results
The end result is a nice pretty graph which gives a visual representation of your investment portfolio over time.
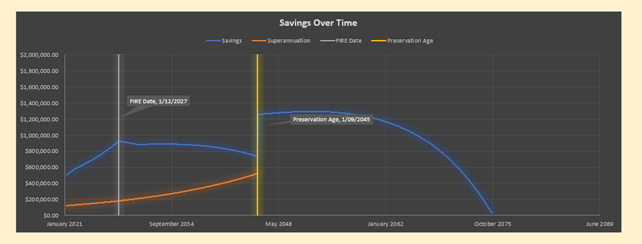
The blue line represents your investment portfolio.
The orange line represents your superannuation balance. As I said earlier, once you reach your preservation age (the yellow vertical line), the balance is added to your investment portfolio.
If you are wondering why there is a bit of a kink in the savings line a couple years after reaching your FIRE date, this is when the loan repayments stop occurring, so your overall expenses is a lot less from this period.
It needs to be mentioned that given there is a lot of assumed numbers (growth rates, inflation rates, life expectancy), it would be irresponsible to base your FIRE date on an optimised situation. As I have said before, there are a lot of unknowns and it is important to be flexible and to have a nice safety buffer incorporated so there you do not need to stress if there is a downturn in the market.
Also, one of the most simplistic approaches is assuming a smooth annual growth of assets, as we all know this is never the case, but we need to be able to make estimates as best as we can to be able to at least plan somewhat for the future.
So, while I believe this spreadsheet is a nice starting off point and gives you a bit of a guide, in no way do I believe it should be followed directly as there are so many different variables which could impact you along the way.
Sensitivity Analysis
One thing I do like to do with spreadsheets as well, is play around with how sensitive some of the inputs are. I want to see how much of an impact will they have on the results if I tweak the numbers slightly. It also gives me confidence to see if there are not significant changes in the results if the numbers do change, I know I do not need to be too pedantic with the inputs in the first place.
I will have a look at three of the most critical factors for this sensitivity analysis:
- Growth Rate of Investments (both inside and outside of Superannuation)
- Inflation Rate
- Effective Tax Rate
From the original results, we had our FIRE Age Start at 42 years and 3 months. This will be the comparison point for the following input changes.
Growth Rate of Investments
Outside of Super Rate to go from 8.00% to 7.00%
Inside of Super Rate to go from 6.00% to 5.00%
With those two changes it pushes out our FIRE Age Start to 44 years and 9 months. 2 and a half years later than we originally had!
Now I want to try going the other way.
Outside of Super Rate to go from 8.00% to 9.00%
Inside of Super Rate to go from 6.00% to 7.00%
These two changes it brings in the FIRE Age Start to 40 years and 4 months. Almost 2 years earlier just with a slightly better assumed return.
Inflation Rate
Increase Inflation Rate from 2.00% to 2.50%
This moves the FIRE Age Start to 43 Years and 6 months. Over 1 year longer just by changing it 0.50%
Decrease Inflation Rate from 2.00% to 1.50%
This moves the FIRE Age Start to 41 Years and 3 months. 1 Year earlier just by changing it by 0.50%
Effective Tax Rate
Tax Rate from 10% to 20%
This moves the FIRE Age Start to 43 Years and 7 months. Over 1 year longer than we originally had.
Tax Rate from 10% to 0%
This moves the FIRE Age Start to 41 years and 2 months. Over 1 Year earlier (I guess that is why tax minimisation is so critical)
As you can see, making relatively small changes with the inputs it can have significant changes in the future. Unfortunately, some of these inputs simply cannot be known from the outset, so that is why we need to be conservative and flexible with our approach to give ourselves the best chance of successfully achieving FIRE.
Feel free to play around with the spreadsheet and carry out your own sensitivity analysis to see how much of an impact it can make on your own situation.
The 4% Rule?
This spreadsheet does not work building up a large sum of money and then living off 4% of that amount each year for the rest of your life. If you were curious (like I was), then I will have a look at how much % of the net worth is being withdrawn each year to see how close it relates to the 4% rule.
I will remove the Loan Repayment as well, as I believe this makes things a bit more complicated.
Without the loan repayment, the FIRE date was brought forward to 1/9/2025. At this time, the investments in the Net Worth were valued at $855,000 and Superannuation was valued at $160,000. This gives a total investment portfolio of $1,015,000.00.
The original annual expenses are $50,000.00 (Net), this is in 2021 currency remember. Adjusting for inflation from our input and tax rate, this annual expense becomes $60,135.12 (Gross) in 2025 currency.
$60,135.12 / $1,015,000.00 = 5.92%
This number is significantly higher than the 4.00% as per the rule of thumb. And keep in mind that the 4.00% rule only really applies over a 30-year retirement period. In this example, you will be retired for 50 years, and you are able to withdraw almost 6.00% of your investment and still be able to survive.
The development of the 4.00% rule considers the fluctuations of the stock market, which unfortunately this spreadsheet does not (and cannot) do.
Conclusion
If you wanted to get realistic numbers out of this spreadsheet, then you may need to be quite conservative with your inputs, so you do not end up with a lot of surprises down the line. The last thing you want to happen is to run out of money when you are around 70 years old and still have a lot of living left to do.
As I have also said in other posts, you just need to be flexible with your FIRE, adaptable to changes that happen mostly out of your control. If the market was a perfect 7.00% return every year, then it would be simple, but it just does not work like that. We need to be able to roll with the punches and adjust our lives to suit external forces.
Finally, there is every chance this spreadsheet has errors, I apologise if this is the case. If you do see something wrong then please let me know and I will do my best to fix it.