Coast FIRE Calculator
I talked about Coast FIRE a long time ago in a post regarding the Different Types of FIRE, but just as a refresher I will give a bit of an explanation on what how I believe Coast FIRE works and how it is different to other FIRE.
Coast FIRE is where you allow an investment to compound on its own without adding any further savings to your portfolio, with the idea that over time your portfolio will grow until you are able to reach your desired FIRE number.
This can be a beneficial way as you might, for example, decide to Coast FIRE the last couple of years before you reach full FIRE, and in this time, you might cut back your hours significantly at work, covering only your expenses and allow your portfolio to grow over that time to reach the desired FIRE number.
Alternatively, an approach I will likely be taking is once I have enough in my portfolio so that it will be able to grow to reach my FIRE number without additional investments, I will then be able to focus all my savings into paying down the loan on my future PPOR. As I have said I do not intend to have a mortgage when I do eventually reach FIRE, so instead of focusing all my savings into my investments, I will instead divert my savings into my mortgage, allowing my portfolio to compound on its own.
Calculator
I have seen a few examples of Coast FIRE calculators around, and while they have all seemed to be fine, none of them really calculated it the way I was hoping for. I believe the main issue was that there were too many assumptions necessary to end up with a final calculation, and if you were to use some of these calculators it would take several iterations to come up with what you wanted to, depending on your situation. There is nothing necessarily wrong with this, but personally, I just wanted something that was more workable for me and so I decided to develop my own.
To have the spreadsheet how I wanted it, I ended up creating a spreadsheet which calculates three different scenarios, depending on the results you are trying to determine. I will try to explain below.
Fixed Variables
Yes, I know the idea of a “Fixed Variable” is an oxymoron, but for this exercise it makes sense. I will have 5 inputs which will remain constant through each of the three different scenarios:
- Starting Age (this is your age you want to start calculating from, I will assume 30 years old for this post)
- Initial Invested Amount (this is your starting off point, which could be set at $0.00 if you were new – this example will start with $200,000.00 however)
- Investment Return (I typically like to assume around 8.00% per annum as a conservative estimate)
- Inflation Rate (I typically like to assume 2.00% per annum, which I hope is conservative)
- FIRE Number (for the example in this post I will assume $1,000,000.00)
Unfixed Variables
I then have three more variables, and depending on the scenario, two of these will be an input and the third will be calculated
- Pre-Coast FIRE Duration (this is the duration between now and starting Coast FIRE)
- Target FIRE Age (this is the age you want to be able to achieve full FIRE)
- Monthly Investment (this is the amount you will be able to invest PRIOR to reaching Coast FIRE)
Scenario 1 – Determine Target FIRE Age
In this scenario, the spreadsheet will be calculating when you will be able to achieve FIRE based on inputs of your monthly deposits and your duration prior to starting Coast FIRE.
If you want to know how far away FIRE is if you started Coast FIRE immediately, you could input the Pre-Coast FIRE Duration at 0 years.
This Scenario is the easiest to calculate as it just tracks the total portfolio value until it reaches the FIRE number.
I will use the following inputs for this scenario.
- Pre-Coast FIRE Duration: 6 Years
- Target FIRE Age: This will be calculated on the spreadsheet
- Monthly Investment: $2,000.00
Results

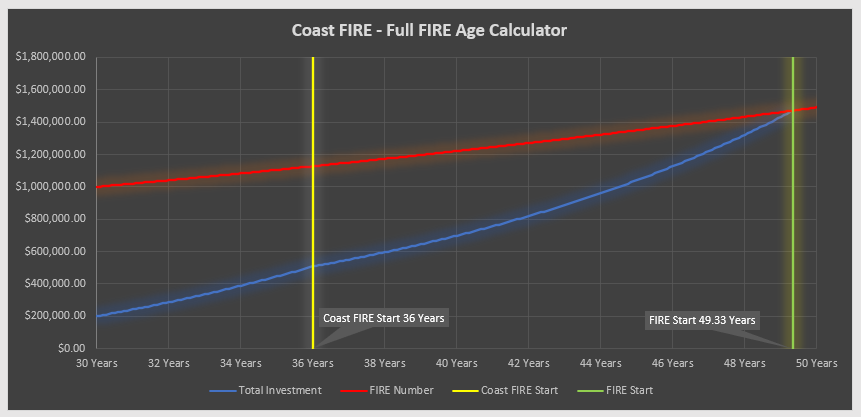
The graph above shows our investment portfolio (blue line) as it reaches the FIRE Number (red line). There are also markers which show when we start Coast FIRE (yellow line) and when we are able to achieve Full FIRE (green line).
Based on the above inputs, our Target FIRE Age will be 49.33 Years Old
Scenario 2 – Determine Coast FIRE Age
In this scenario, the spreadsheet will calculate how long you will need to make a set contribution, before you can start Coast FIRE, in order to be able to achieve a set Target FIRE age.
This calculation was slightly more difficult, as I wanted to find the minimum duration of pre-Coast FIRE that would meet the criteria. I modelled simulations starting with contributions for 3 months, 6 months, 9 months etc, until it found the first simulation which was able to achieve FIRE by the Target Age.
There is most likely is a more elegant way to calculate the number, but I do not mind a more brute force approach if it works for me to be honest.
I will use the following inputs for this scenario.
- Pre-Coast FIRE Duration: This will be calculated on the spreadsheet
- Target FIRE Age: 48 Years Old
- Monthly Investment: $2,000.00
Results

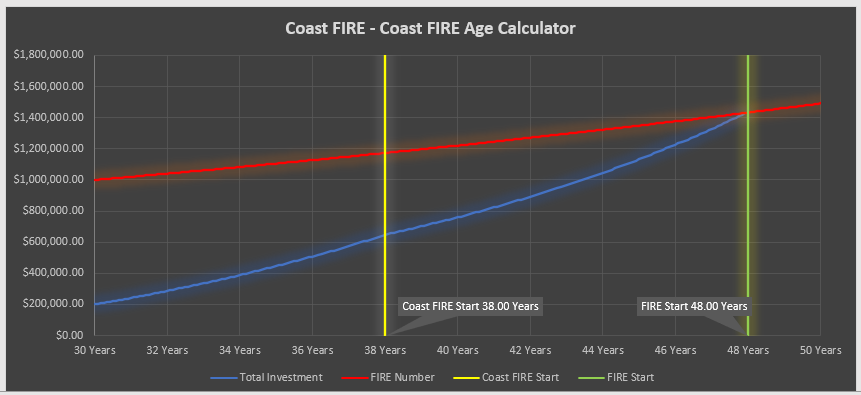
The graph shows us starting Coast FIRE at 37.25 years, given our starting age of 30 years, it means we would require a Pre-Coast FIRE Duration of 7.25 years if we were hoping to reach FIRE by 48 years old.
Scenario 3 – Determine Monthly Investment
In this scenario, the spreadsheet will calculate the minimum monthly contribution required to make during the pre-Coast FIRE duration, so that when you reach Coast FIRE, you will have enough to grow to reach FIRE by the target age.
Similar to Scenario 2, I modelled different simulations, starting with $250 per month contribution, then $500, then $750 etc until I found the minimum amount which successfully reached FIRE by the Target Age
I will use the following inputs for this scenario.
- Pre-Coast FIRE Duration: 7 Years
- Target FIRE Age: 45 Years Old
- Monthly Investment: This will be calculated on the spreadsheet
Results

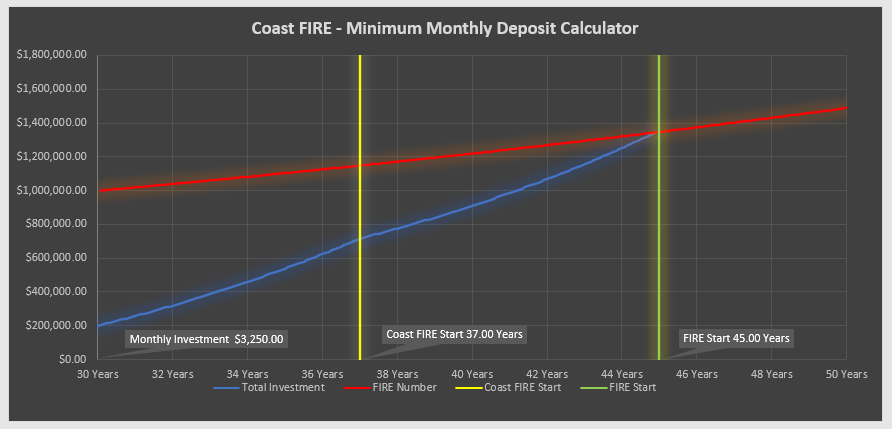
I have added a callout on the graph to show that the Monthly Investment to meet the criteria regarding Coast FIRE and Target FIRE age was $3,250.00.
You may also notice that the Total Investment (blue line) does exceed the FIRE Number (red line). This is because I went up in increments of $250 for the monthly investment, I could have been more accurate if I went up by smaller increments, but it would have made the spreadsheet unnecessarily large, and I do not believe it would have added any significant benefit.
Access to Spreadsheet
If you want to have access to the spreadsheet you can obtain it from this link HERE.
I have not put any write protect on any cell as I want you to be able to see the calculations being performed, but I cannot help if you delete a formula or adjust a cell by mistake.
Also, you may need to adjust the formatting on the charts as I had to fix the X and Y Axis limits to make the graphs look suitable.
If there are errors in the spreadsheet, then I apologise as it was not my intention, but I am far from perfect. Let me know if you do find something and I will do my best to rectify in a timely manner.
Conclusion
One thing that still needs to be said, is that a lot of this is only estimating and making assumptions. The biggest assumption is probably the annual return of the market. Over the very long term, this assumption is fine to make, but over a 10-year period or so, then it might be quite tricky to be accurate enough to be used for calculations given the fluctuations in any market.
If you were trying to forecast these numbers and plan for a future based on them, I would recommend regular tracking to ensure you are still on track to meet the targets, and re-evaluating if necessary.