Changing my Living Situation – Part 2
I wrote this POST recently, and at the time I did not intend to write a second part but after doing some more thought on the idea of changing my living situation, I felt it was necessary to look at creating a new spreadsheet to model some additional scenarios for my potential future.
In this post I will take into account my borrowing capacity depending on the scenario that is being calculated. After looking at potentially purchasing a property, and using mortgage calculators, I realised that my borrowing capacity varied significantly depending on my current loans (which I have for IP 1 and IP 2)
I do find it interesting that although my Investment Properties are both positively geared significantly, removing them from the calculations does allow me to borrow more. I do understand they perceive the debt as risk, and if there is an extended vacancy in the property and/or an interest rate rise it does leave me vulnerable. I still would have thought there was enough of a buffer zone to allow an increased borrowing capacity with the properties, but evidently that is not the case.
Borrowing Capacity
I used the mortgage calculator from Athena to calculate the borrowing capacity given the different scenarios with the results as per the below:
Not selling any IPs – $339,500.00
Selling one of my IPs – $538,500.00
Selling both of my IPs – $730,000.00
These borrowing capacities are not set in stone as they are only estimates, but they are good enough for my calculations.
Scenarios
I will look at the following different scenarios for these simulations:
Scenario 1 – Continue renting and keep both Investment Properties
Scenario 2 – Continue renting and sell Investment Property 1
Scenario 3 – Continue renting and sell Investment Property 2
Scenario 4 – Continue renting and sell Investment Property 1 and 2
Scenario 5 – Buy PPOR 1 and keep both Investment Properties
Scenario 6 – Buy PPOR 2 and sell Investment Property 1
Scenario 7 – Buy PPOR 2 and sell Investment Property 2
Scenario 8 – Buy PPOR 3 and sell Investment Property 1 and 2
PPOR 1 will have the minimum borrowing capacity, PPOR 2 will have the middle borrowing capacity and PPOR 3 will allow for the highest borrowing capacity.
The inputs will still be put in as variables, so PPOR 3 could be the same as PPOR 2 (as long as the borrowing capacity for the scenario allowed it)
Inputs
I will use the following inputs for the simulations within the spreadsheet
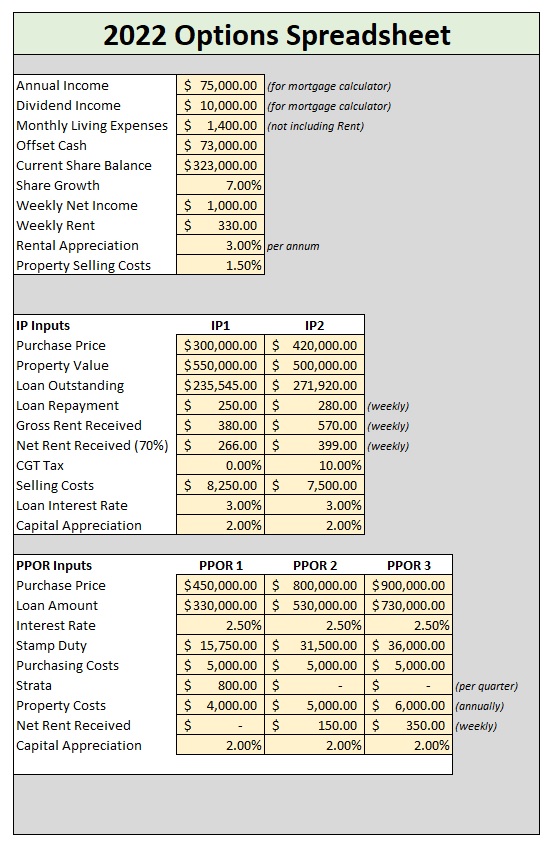
One of the most impactful variables is capital appreciation, for the purposes of this spreadsheet I have assumed that the capital appreciation of each property will be 2.00% per annum for each property. I believe this is conservative enough for the purposes of this spreadsheet.
With regards to the PPOR Inputs there are a few things that are worth noting:
- In the price range available (approximately $450,000), the only available properties would be apartments/units and would come with a strata cost. I prefer to avoid apartments for this reason, but in this price range in the location I would need to live this would be a necessity unfortunately.
- I have allowed for an input of Net Rent Received, if I was living in an apartment, I do not believe I would want to rent out any of the rooms, so I have left it at $0 for PPOR1. PPOR 2 would have an option for a room to be rented out hopefully, and PPOR 3 I would be aiming for a property with a granny flat situation, where I could rent out the main house and live in the granny flat, hence the higher rent received amount.
Also, there were a couple things to note with the IP inputs:
- There was no CGT component with IP 1 as it was my PPOR within the last 6 years.
- I assumed a CGT rate of 10% for IP 2 to account for 50% CGT discount and my approximate tax rate.
I will run the simulation over a 10-year period, measuring the total value of each scenario over this period. It is important to note that in Scenarios 5 – 8 (where a PPOR is bought), the total value has taken into account the selling of the PPOR. All of the scenarios assume the selling of the IPs when calculating the total value (if they were not sold already)
Results
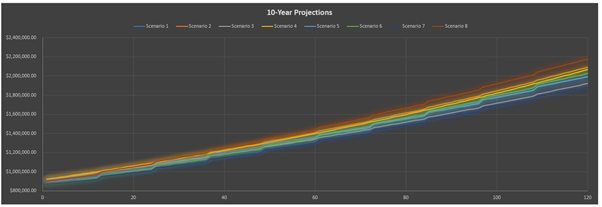
It can be a little difficult to make out what is happening in the graph above, below is a table summary of the position of each Scenario over the 10-year period. I have also colour coded the highest performing and lowest performing scenario during each year.
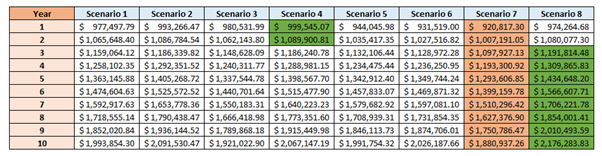
While I do like to look at graphs most of the time, I feel that looking at hard numbers in this particular instance does tell a bit more of a story.
Immediately I can see that Scenario 3 and Scenario 6 are the worst performing scenarios to come out of this simulation. That is not too much of a surprise as that would involve selling my IP with the higher cash flow, while keeping my IP with the lower cashflow.
After the 3rd year, the optimum scenario is Scenario 8, which is selling both of my IPs and purchasing a property around $900,000.00. However, this would assume being able to collect approximately $350 per week in rent while I was living there as well. If I was not able to collect rent money after purchasing the property it would no longer be the most favourable option.
Changing Variables
While it is nice to have the spreadsheet available to carry out the calculations and comparisons quickly, given the variables available, it can be difficult to really assume what are reasonable variables to use.
Most of the ones I have can be estimated reasonably accurately, but the biggest estimate is the capital appreciation. And unfortunately, while it is the biggest estimate, it also has the biggest impact if the number changes.
For example, if I change the capital appreciation of IP1 and IP2 up to 4.00% for both of them, then keeping the properties becomes the best option. If I reduce all the capital appreciation down to 0.00% (for the IPs and PPORs), then all of a sudden renting and investing in shares makes the most sense.
Discussion
My next step will be to talk to the real estate agencies, at the moment I am only going off estimates for the property values. And it might just so happen that the estimates are significantly different to reality. If the numbers were different (either higher or lower) then it could have dramatic ramifications on what my future plans would be.
It is worth noting that I was always planning on selling my IPs when I did reach FIRE, looking at numbers like this may look to bring forward my plans however.