Change In Volatility in Share Market Over Time
Today I wanted to look at if there has been a change in volatility of the share market over time. I have heard both arguments that there is significantly more volatility in today’s markets because of the ease of access to the market, there is a substantially higher number of trades at any one point, so if there is a swing in the market (either up or down) it can happen very quickly with minimal warning. I have also heard that there is less volatility now because there is much more regulation within companies and the market in general, and the reserve banks have greater ability to keep things more under control.
Both of these arguments can make sense, somewhat, and you could easily be convinced one way or the other depending on how persuasive the argument put forward to you was.
Data
I will be using the ALL ORDs index which is based on the top 500 companies on the ASX. The data is available back to 1875, which is a nice long timeframe to use, but I only have daily prices of the index from 1980 onwards, before that (between 1875 and 1979) I only have monthly prices. That is not ideal to determine the volatility as I am wanting to know the daily changes in prices, but it is better than nothing, and even being able to compare the volatility between 1980 and now will be useful.
Methodology
Initially I was going to use the average standard deviation of the price of the index over time, but I found that this was not going to work, because as the share price grew bigger, the standard deviation also grew bigger, so it was not really a useful metric I found.
Instead, I have used a standard deviation based on a percentage of the change from the average price of the respective month/year.
I will also look at measuring the average absolute change in price over the month/year to determine if there were particular timeframes which were of higher volatility than others, and if there were any trends developing.
I believe, while it may not be the most comprehensive analysis possible, it will at least provide an indication if there is any particular trend of increased or decreased volatility over time.
Results
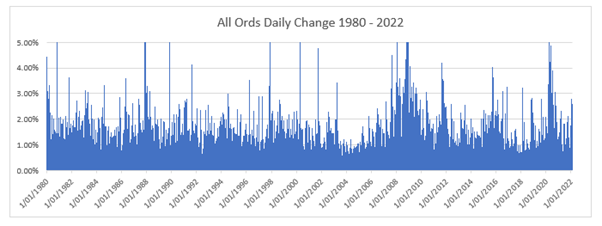
This first graph shows the average daily change (in percentage) for each month between 1980 and 2022.
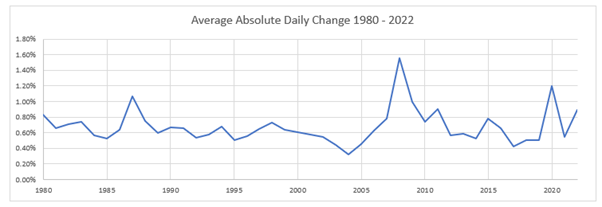
There are definitely some peaks, which coincide with market crashes typically (as these tend to provide the most significant changes in price). You can see peaks during the 1987 Crash, 2008 Crash and 2020 Crash very clearly reflected in this chart.
This next graph shows the average monthly change (in percentage) for each year between 1875 and 1979
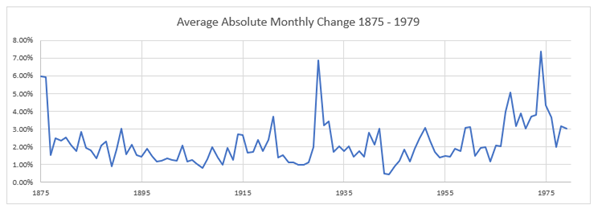
Similar to the previous graph, there are some peaks where there were crashes, first in 1930 and then again in 1974. There may be a slight trend showing an increase in volatility from 1960-1979, but overall, the trend is relatively flat from 1875-1960.
This next graph shows the individually monthly price change (in percentage) from 1875 – 1979
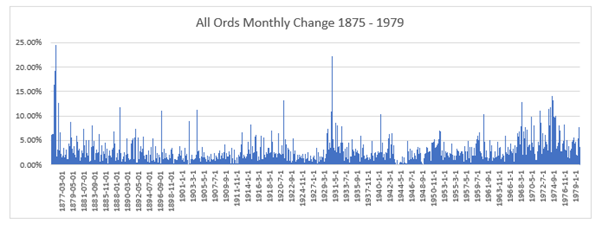
There are several large peaks where there are the crashes which do reflect the increased volatility, it can also be shown there are more regular higher peaks from around 1960-1979, which does indicate some extra volatility in this period. This was shown on the previous graph also.
The next two graphs show the daily change in price (in percentage) from 1980 – 2022. The first graph shows all the results, but there is a couple outliers which skew the results significantly, so the second graph adjusts the scale to be able to make out the other results a bit easier.
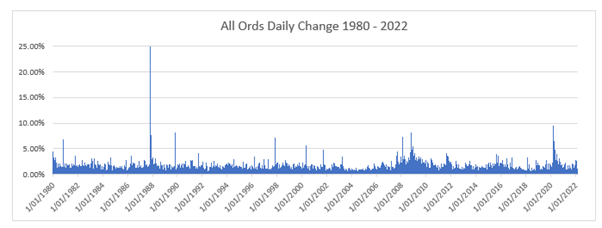
As you can see there was a significant change in price that occurred during the 1987 crash. The other crashes in 2008 and 2020 look insignificant in comparison. Apart from these peaks however, it does not appear to indicate any additional volatility over the time-period. It seems to just be centralised around the crashes (which definitely makes sense)
The next graphs will show the standard deviation based on the change from the average price. Again there will be two graphs for 1980 – 2022 as there is a large outlier which makes it difficult to determine the remaining results.
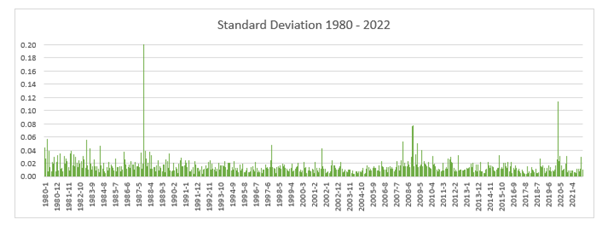
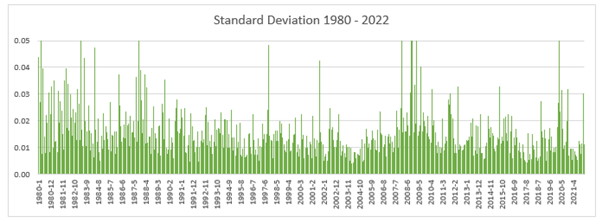
Although the numbers are calculated different, it still seems to mirror the results from the daily change in price quite well, which is interesting. As before, there are large spikes of volatility around the crashes, and apart from that there does not seem to be any significant trends.
The final graph shows the standard deviation between 1875 – 1979, this is based on annual results based on the average variance of the year.
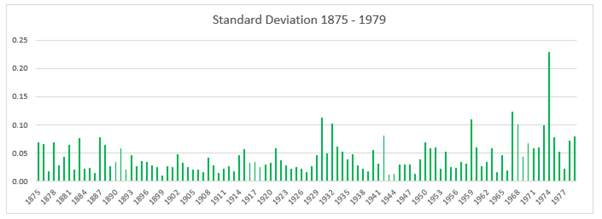
Similar to the earlier graphs, there is some increased volatility from around 1960 – 1979 which also coincides with a crash in the market around then. Apart from that there is some slightly higher volatility around the big crash of 1930.
I will state that I am not exactly sure how comparable the standard deviation number is between 1980-2022 and 1875-1979. Although they come back with a number, since one is calculated using daily change in price and the other is calculated using monthly change in price, I would not believe they are directly compatible. For example, the standard deviation of 0.05 in 1920 does not necessarily indicate the same amount of volatility in 1997 even though they both had the same standard deviation number.
Discussion
Without looking too deep into the numbers, and just basing it on the graphs I have shown, I cannot see any real trends indicating either an increase or decrease in volatility. The only constant seems to be is that there is a significant increase in volatility when there is a crash in the market, but this was already known. If there are more crashes occurring, then this would indicate a higher level of volatility. However, I do not believe crashes have been occurring more frequently at different times.
There are also definitely some short-term lulls in volatility, which might last a couple of years or so, but they seem to occur at regular intervals throughout the whole timeframe, without really increasing in magnitude and/or length.
While I definitely find this sort of analysis interesting, I do not think there is anything particularly useful to get out of this information. It does not appear to be any more or less volatile these days compared to what it was 140 years ago. One thing to note is that there is definitely a cluster of volatility around market crashes, but given the quick drops that occur around these, with potentially somewhat quick recoveries, this is to be expected.