Change in A200 Over Time
In this post I want to have a look at how much the ETF A200 from BetaShares has changed over time. I will be comparing what the ETF looked like back in March 2021 compared to what it looks like now in December 2021. It is only 9 months apart but I was curious how different the overall ETF will look.
I will compare the following when I am making the comparison:
- Ranking (based on weighting) to see if individual holdings have moved up or down over time. As well as if they are new to the ETF or have fallen off.
- Change in weighting of the individual holdings of the ETF. I will be comparing the % change in the weighting, rather than the absolute % change of the weighting. For example, if a weighting of a holding has gone from 8.00% to 10.00%, then that will count as a +25% increase in weighting, not a +2.00% weighting. I feel this is a more accurate reflector on the change as some of the weightings are particularly small so absolute change might not be a great indicator.
Below is a table summary of the comparison of the individual holdings within the ETF.
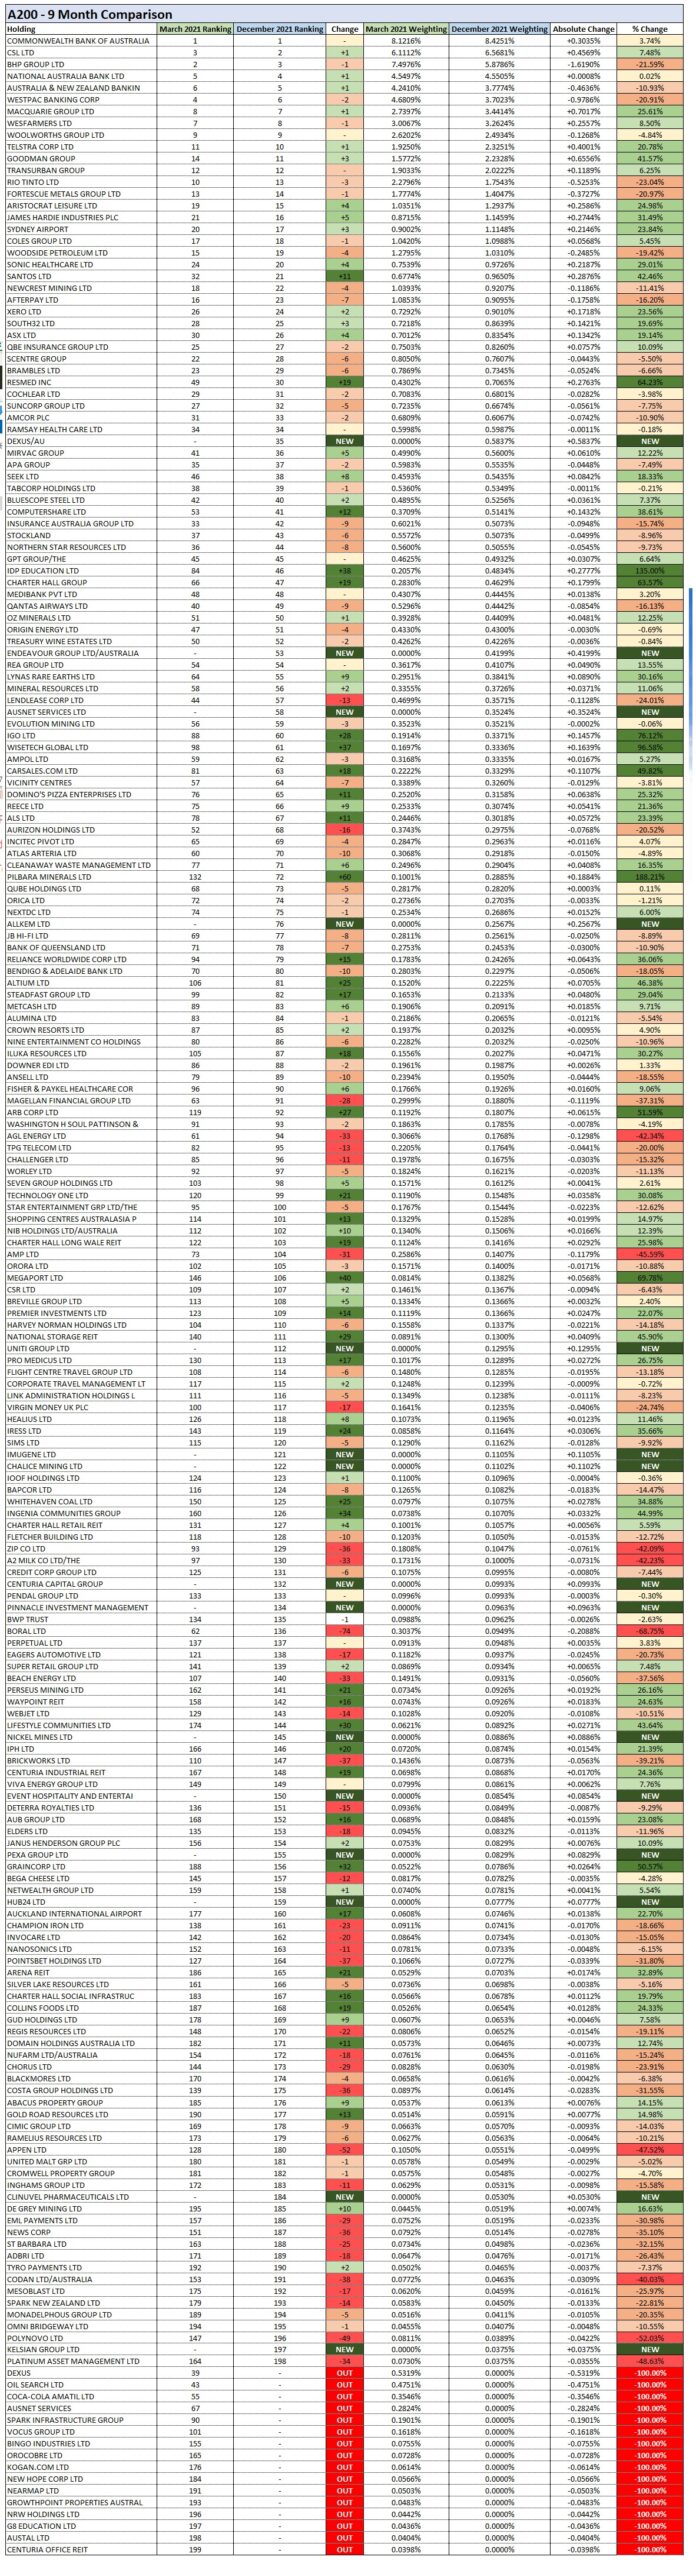
As you can see, there is a lot of changes in the ETF, but one thing that is interesting to note, the top 20 holdings of the ETF in both March and December represent about 59% of the total weighting. And the top 20 does not show much of a change between March and December (with 18 out of the 20 companies remaining the same over the time period – although there is some changing in the rankings among those 18 companies)
Overall there were 15 companies that fell out of the ETF over the 9 months with 14 companies coming in to take their place. It is worth mentioning that there is not always 200 companies that make up the ETF, the number does fluctuate around 200 but can be slightly above or below at times.
Big Gainers
I will now look at which listings were able to either be new in the ETF, or jumped up 30 or more places in the rankings. Overall there were 22 companies which met this criteria.
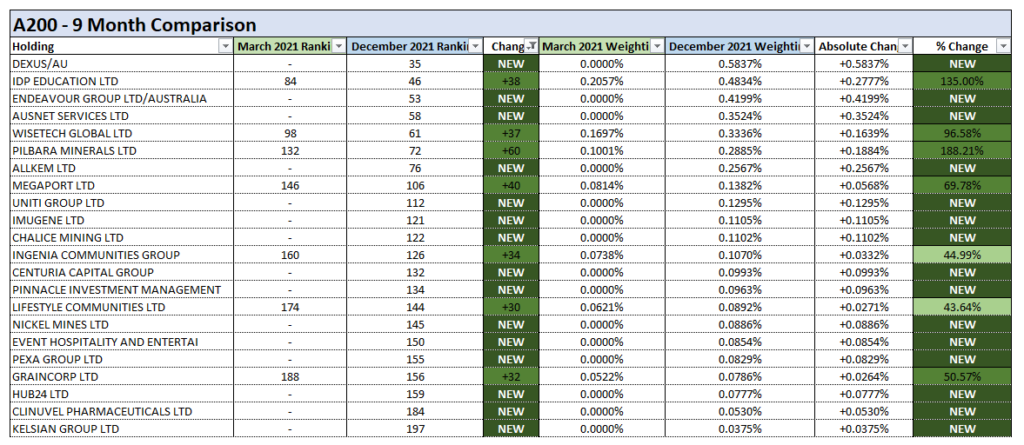
The majority of ompanies on this list have had significant share price increases over the past 9 months, although to be honest I have never heard of the majority of them. Obviously they are doing pretty well though.
Just to pick out a couple at random:
Wisetech Global Ltd – Share Price has gone from about $28.00 in March 2021 up to just under $60.00 by December 2021
Graincorp Ltd – Share Price has gone from about $4.20 in March 2021 up to about $7.80 by December 2021
I should mention that the selection criteria for listings is actually based on the Market Capilisaton Value of the listing, not quite the share price. Just a quick refresher, the Market Capitlisation refers to the total value of all a company’s shares of stock and is calculated by multiplying the price of a stock by the total number of shares.
This means that a share price may remain the same, but if the number of shares doubles, then the Market Capilisation will have doubled over time as well.
Big Losers
I will now look at the listings which have fallen at least 30 places or have dropped out of the ETF completely. Overall there were 29 listings that met this criteria.
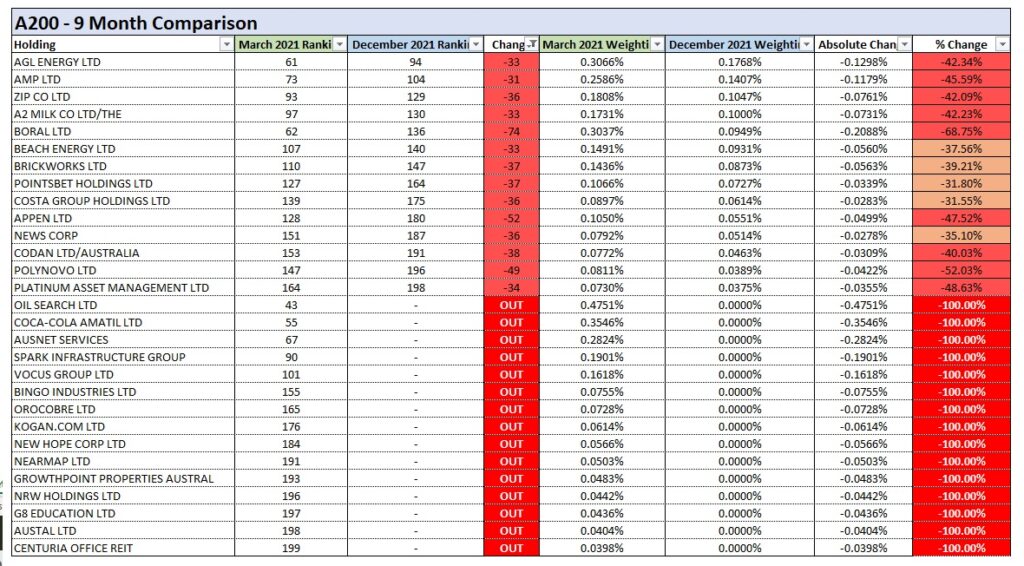
Just to pick out a couple at random:
A2 Milk has gone from around $9.50 in March 2021 down to around $5.50 in December 2021. I remember seeing a lot of people upset about this stock, seems a lot of people backed it to be a winner.
Boral Ltd – This is a good example of the market capilisation being impacted without the share price being impacted significantly. The share price between March 2021 and December 2021 has gone from $5.50 to $6.00. The price has actually gone up 9% over this time period.
But the Market Cap of Boral actually went from $3.4m in March down to $1.8m in December.
Conclusion
There is nothing too groundbreaking to get out of this post, I just found it interesting to point out the changes that occur in an ETF over time. Keep in mind that A200 only comprises of approximately 200 shares at a time, compare this to some larger ETFs which may have thousands of listings, you can imagine the turnover rate.
The most important fact to realise with this is that when you have a market based ETF like A200, you will be able to be a part of all the big gains, and also drop off all the big losers. There is the issue is not being able to maximise the full gain of the big movers, as they might have to gain a fair bit before they reach the index fund, but the long term winners will still become part of your portfolio.
Also, the listings that are going down, eventually they will drop out of your ETF and be replaced by ones that are hopefully on their way up, so while you will have to take some of the hit for their drop in price, you won’t have to take the full hit if you held on to that individual listing and it did go down to zero.