Are ETFs Cheaper at Different Times of the Month?
I recently watched a video on YouTube of a content creator who is similar to myself and shares a lot of their financial journey on their way to FIRE. Recently, they uploaded a video and they looked at the price of the ETFs they currently purchase and noticed that over the past two years, the price of the ETF has been cheaper (compared to the monthly average) at the beginning of the month.
Being a particularly data driven individual, I found this somewhat interesting, however there was not a significant dataset used in their example, so I decided to do some further research myself. I was not necessarily expecting to find if ETFs were cheaper at the start of the month, but just to see if there was a particular trend in prices of ETFs throughout the monthly period cycle.
Background
For the purposes of this data analysis, I will use the following ETFs and analyse them since their inception date:
STW: SPDR S&P/ASX 200 Fund (STW.AX) – Start Date: 2/1/2008
VGS: Vanguard MSCI Index International Shares ETF (VGS.AX) – Start Date: 18/11/2014
VDHG: Vanguard Diversified High Growth Index ETF (VDHG.AX) – Start Date: 20/11/2017
SPY: SPDR S&P 500 ETF Trust (SPY) – Start Date: 1/2/1993
I am only looking at these four ETFs, so it may not be the most comprehensive data, but I think if there is a real trend that happens, then it might start to show after these four ETFs were analysed.
Methodology
The historical data for each ETF is relatively easy to obtain from Yahoo Finance, so I was able to get a daily share price of each ETF. With these data sets I carried out a series of analysis to see if there were any trends appearing.
Analysis 1: Look at frequency of Max/Min ETF prices (compared to average monthly price) for each day of the month.
I also had to account for the number of times overall that each day of the month would have actually occurred. Immediately it should be obvious that the 31st day of the month will occur the least frequent. Also, because the share prices are only provided on trading days, there are days that fall on weekends or holidays, over time these will even out, but still I accounted for total frequency of each particular day as well.
For example, with STW, there were 164 months of data available, but there were only 65 times the 31st occurred within the dataset. There were 6 instances where the maximum price for the ETF occurred on the 31st, but to account for the frequency of Day 31 occurring, I divided 6 by 65 and end up with 9.23%. Similarly, Day 20 also had 6 occurrences where it was the highest ETF price, but Day 20 occurred 113 times, so the rate of Day 20 having the highest price was only at 5.31%.
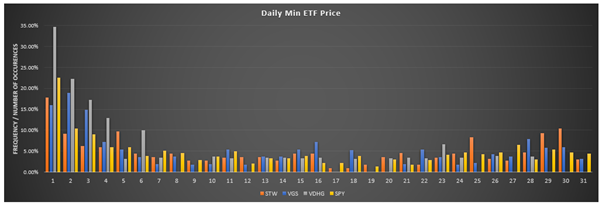
Below are the graphs to show which day the Maximum/Minimum Price occurs among each of the 4 ETFs.


It might be difficult to make out the individual results shown, but I think there is definitely a trend showing. It is not as obvious in the Daily Max ETF Price – however it does still tend to lean towards the back end of the month having the highest monthly price.
The Daily Min ETF Price shows quite starkly that there is definitely a trend for ETFs to have a lower price at the beginning of the month (within the first week) than the rest of the month.
Looking at these results in isolation, it does seem to be in line with what I watched in that YouTube video, ETFs do seem to have cheaper prices earlier in the month. Then I decided to think about why this might be the case, and that is when I realised that maybe data like the above is misleading. The reason prices are lower at the start of the month compared to the middle and end, might just be because prices are trending upwards over time, and even in smaller times, over the month. With this in mind, it makes sense that the prices earlier in the month are normally cheaper than prices later in the month.
Analysis 2: Compare relative price of ETF throughout the month to average monthly price.
Now I wanted to do a bit more an analysis on the ETF price movement through the month, to see if there is a trend of prices rising throughout the month. If this is the case, then it would most definitely explain why there is a higher frequency of the lowest price occurring at the start of the month.
For this analysis, I calculated the average value of the ETF for each month and compared this to the daily value of the ETF in terms of a % difference.
For example, with STW, on 1/2/2008 the Daily Price was $56.26. The Average price for the month of February 2008 was $54.43. This means the change % of Day 1 from the average is 3.36%. I then take all the change % for each of the 101 Day 1s in the dataset, average this number, and end up with an average change from the average monthly share value of -0.26%. What this means is that on average, the share price on Day 1 of any given month will be 0.26% lower than the average share price of the respective month.
Below is the graph which shows the trend for each ETF for each day of the month.

As you can see, the graph is somewhat all over the place, there could be some results which really do skew the numbers a bit. Overall, it does appear that there is an upward trend in price over each month, with the start of the month on average lower than the average monthly price for each ETF. Conversely, each ETF has a higher ETF price compared to the average monthly price at the end of the month.
This fits in line with the idea that the trend of lower ETF prices occurring at the start of the month is more a factor of the overall trend for rising ETF prices through the month.
Analysis 3: Comparing the share price from the End of Month 1 to the Start of Month 2
I think this is where the results will start to look interesting, I want to now compare the price at the end of one month to the start of the following month. This was a relatively simply analysis to carry out, at the start of each month, I compared the ETF value at the start of the month and compare this to the ETF value for the previous month.
Once this is calculated, it is just a simple count of “Higher” or “Lower” occurrences for each ETF. This does not take into account the magnitude of the change in ETF price at all.
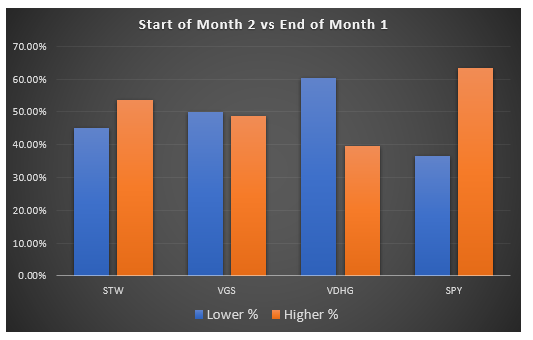
Below is a graph which shows the occurrences for each ETF.

This is actually a bit of a mixed bag of results, STW and SPY both seem to show a tendency for the end of the previous month to have a lower ETF value compared to the start of the following month.
I thought about it though, and I was only comparing a single data point against a single data point. I don’t know if this was ideal as there can be temporary fluctuations which might skew the overall results.
Analysis 4: Compare the Average price from End of Month 1 to the Average price at Start of Month 2
This is similar to the previous analysis, but instead of just looking at the first and last day of the month, I instead take the last 5 days of the month, average them, and compare that to the average of the first 5 days of the following month.
These averages are then compared with each other, and as before, a “Higher” or “Lower” count is calculated.
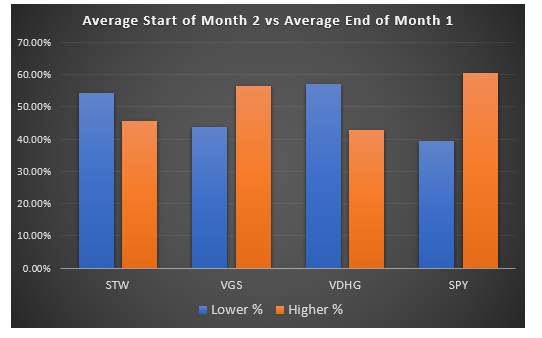
Below are the results of the analysis.

I am more confident to look at these results compared to the previous one. But it still appears to be a bit of a mixed bag, interestingly STW has actually reversed where it seems to indicate share price has actually been going down at the start of next month.
VGS has also reversed, although it was very even in the initial analysis. VDHG and SPY still provide similar results (although they do also seem to conflict with each other). In the end, does not appear to be too much of a trend appearing unfortunately.
Analysis 5: Compare investing money at the start and end of the Month.
Honestly, I probably should have just done this one right at the start. It would have provided the answer if there was a trend or not, if ETFs were cheaper at the start of the month, then surely investing at the start of each month would provide a significantly higher return than the end of the month?
For this analysis I invest $5,000 per month, either at the start or the end of the month. I have not included any dividends as they should be the same for each scenario. I will note that however that not including dividends has significantly impacted the returns for the Australian based shares.
Below is a table of the results.

On the surface, there really does not appear to be much of a difference. For VGS and VDHG, there is a slightly higher return, but this is due to an extra occurrence of end of month occurring, that is why I have included the Invested Amount as well for the period.
I decided to look at the per annum return of each option as well, the results are shown in this table.

As you can see, the results are very similar, but I will note that there is a very slight improvement in 3 out of the 4 cases of investing at the start of the month compared to the end of the month.
VDHG does have an improvement of 0.16% which is actually somewhat impressive to be honest, but the next largest difference is with VGS at 0.08% improvement. So, while it is an improvement, it is still fairly negligible.
Conclusion
After carrying out the analysis to determine if there was a trend between ETF price and day of the month, there were some slightly interesting results. Initially, I was excited when I saw that the earlier days of the month tended to have a lot higher frequency of lower price for shares. Upon further analysis it appears to show that it does not actually represent a “bargain” price for ETFs but is more representative of just a trend of ETF growth over time, just over a shorter period.
In the end, it was mostly illustrated with the final analysis and looking at the difference in return if you invest at the start or at the end of the month. In my opinion, the return difference is negligible and not even reliable enough to be considered worth it.
For me, I do tend to invest at the start of each month, but this is only because I receive the rent from my investment properties at the end of the previous month. If I did receive my income generally around the middle of the month, I would see no reason to hold off investing for a couple of weeks to time it with the start of the month. I would believe it would just be the best to invest as soon as you can, rather than waiting.