Are ETFs Cheaper at Different Times of the Month? – Part 2
A couple months ago I did this POST which did some pretty basic analysis into ETF prices through the month. When I had finished writing that post, I did not really find any real noticeable trends with regards to ETF prices through the month, but I had read a things like this:
The Best Day of the Month to Invest
There is no single day of every month that’s always ideal for buying or selling. However, there is a tendency for stocks to rise at the turn of a month. This tendency is mostly related to periodic new money flows directed toward mutual funds at the beginning of every month.
In addition, fund managers attempt to make their balance sheets look pretty at the end of each quarter by buying stocks that have done well during that particular quarter. Stock prices tend to fall in the middle of the month.
So, a trader might benefit from timing stock buys near a month’s midpoint—the 10th to the 15th, for example. The best day to sell stocks would probably be within the five days around the turn of the month.
This is an excerpt from the following page – Investopedia – I figured these guys are normally on to something so maybe I could do a bit more research into the matter. I wanted to see if there was any sort of evidence that around the midpoint of the month seemed to be the best time to buy shares. I am not concerned with selling shares, as this is for long term investing, so only concerned with the buying.
Methodology
In this analysis, I am simply going to perform 28 different simulations, buying shares on Day 1, Day 2 etc up to Day 28 of the month. I am not going to include Days 29-31 as not all months will have these, and I wanted to keep it as standard as possible.
Each month I will invest $5,000.00 on the selected day. The simulations will also take into account weekends and holidays and will purchase shares on the closest opportunity.
I will use six ETFs for the analysis, again it is not the most widespread analysis, but if there was a significant trend, hopefully it would start to show up.
ETFs Used
VGS: Vanguard MSCI Index International Shares ETF – Start Date: 18/11/2014
VDHG: Vanguard Diversified High Growth Index ETF– Start Date: 20/11/2017
SPY: SPDR S&P 500 ETF Trust – Start Date: 1/2/1993
VAE: Vanguard FTSE Asia Ex-Japan Shares Index ETF – Start Date: 9/12/2015
VTS: Vanguard US Total Market Shares Index ETF – Start Date: 8/05/2009
VAS: Vanguard Australian Shares Index ETF – Start Date: 1/05/2009
The end date for each simulation will depend on the start date of the ETF, as I will ensure there is an even number of investments for each simulation. For example, VGS will finish on 17/09/2021.
Results
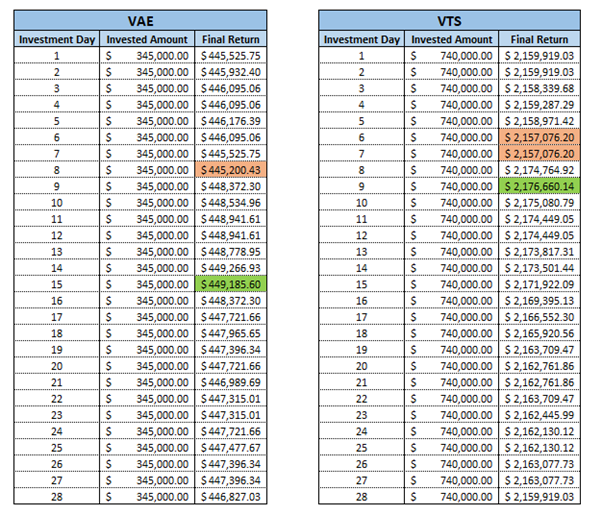
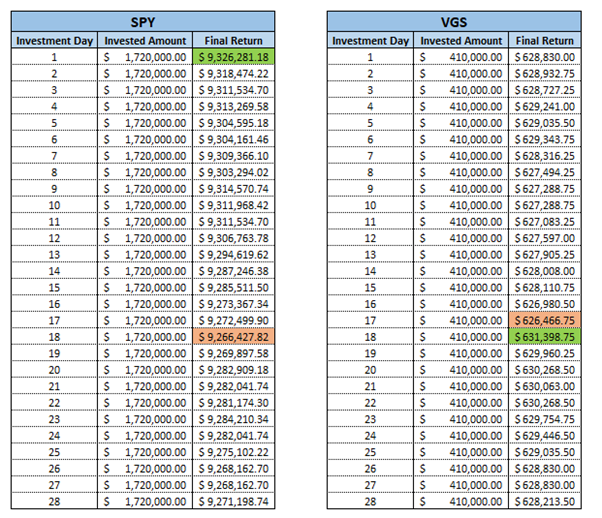
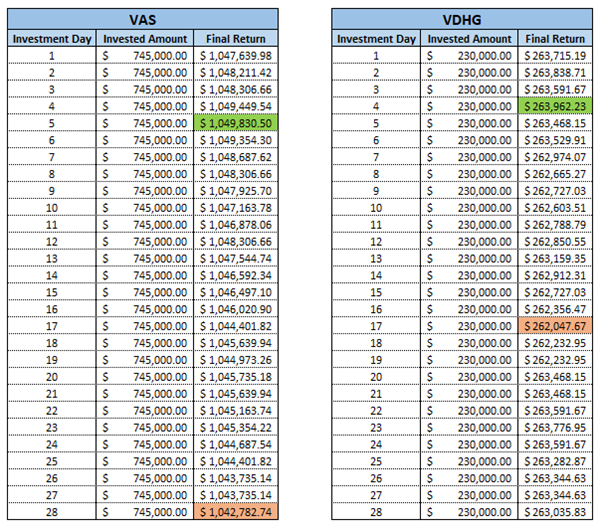
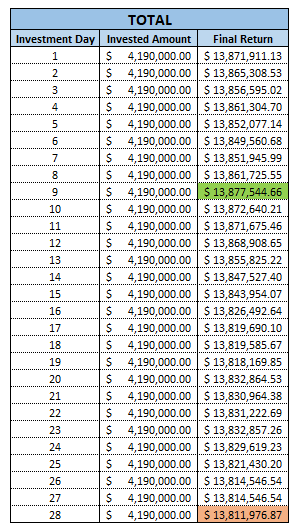
Above are a summary of tables which show the results from investing on each day of the month for the respective ETFs, as well as a TOTAL table which is a sum of all the ETFs and their corresponding days.
One quick thing to point out is how incredible compound interest can be, you can really see in the longer-term ETFs how the returns have really been compounded over time and providing some really significant numbers.
In summary, the results are as follows:
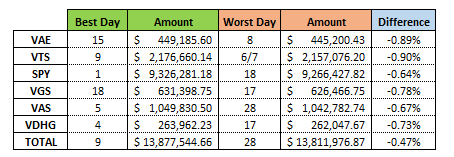
It does not appear to be any significant trend with regards to returns on a specific day at all, some of them have better returns at the start of the month, others towards the middle. The only potentially interesting thing to note is that the latest occurring “best day” is 18th for VGS, so potentially if you do invest before this day it might lead to better returns.
Although, looking at the difference between the best and the worst, it really is quite minimal, in all instances it is less than 1.00% difference. I thought looking at the numbers of SPY where it was $60,000 difference, which is definitely significant, but when you are talking about $9.3m it does become a relatively small difference.
Keep in mind this is comparing the best to the worst, and chances of being able to pick the best day for any particular ETF is relatively small.
One particular thing that was interesting was it seemed to be a lot of the “best day” results occurred on the same day the ETF started, I am not exactly sure why this is but it occurred with both SPY and VGS (on the 1st and 18th respectively), so that is somewhat interesting.
I decided to do a comparison if you had invested on the same day as the respective ETF started what the results would look like in total.
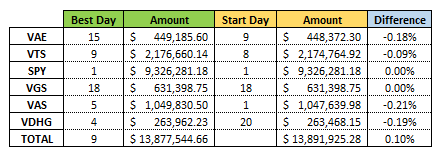
Interestingly, if you had invested on the start day of each ETF, you actually end up better off (0.10% better) than investing on the “best day” for all the combined ETFs. Keep in mind that the “best day” for the TOTAL category isn’t a sum of all the other best days, the day when the corresponding days is the highest, if that makes sense.
Lastly, I will just have a look at investing in different portions of the month, divided up into the following:
Start: Days 1 – 9
Middle: Days 10 – 19
End: Days 20 – 28
I will average the results from the individual day to come with a portion average for the timeframe.

Once again, I really cannot see any sort of trend developing, there might be better performing results earlier in the month, but it really is not of much significance if there is a trend at all. And as before, the difference between the best and the worst is not too significant.
Summary
So, while there are days of the month that investing on a particular ETF are beneficial, there does not seem to be any particular trend that you could pick a day or timeframe for all ETFs and be confident of obtaining a higher return. Maybe if you were to invest in the first half of the month then you might obtain slightly better returns, but I do not think it would make a great difference (if any).
Although I did not obtain anything conclusive from doing this post, I am still glad I carried it out because at least it is something I can rule out for the future. Unfortunately, I do not believe there are any “tricks” that can be taken advantage of with regards to investing, if there was it would have been found out a long time ago and it would soon not be a “trick” anymore.