Are Internally Leveraged ETFs a Fast Track to FIRE?
One of the biggest advantages that property has over shares is the ability to leverage easily, that is, using debt to increase your exposure to the market. There are a couple of options which are available for shares to be leveraged, namely NAB equity builder and margin loans, but these are somewhat complicated and not always an ideal situation.
In this post I want to talk about “Internally Leveraged Funds” or “Internally Geared Funds” and how they allow leveraging of shares. I had only first heard about these a week or so ago, I had no idea they existed but upon finding out I was immediately intrigued and wanted to look a bit further into it. On the surface, they appear to have the potential to magnify returns significantly higher than just regular investing.
In this post I will mainly be referring to the BetaShares product ASX:GEAR (Geared Australian Equity Fund). This product provides geared long exposure to the returns of the Australian share market (as measured by the ASX200 accumulation index).
How Do Leveraged ETFs Work?
Leveraged funds use derivatives or debt to magnify the daily returns (whether positive or negative) of an asset class of index.
In comparison, a standard ETF generally tracks the underlying securities of an index 1:1, while a geared fund may aim for a 2:1 or 3:1 ratio.
For example, GEAR combines funds received from investors with borrowed funds and invests the processed in a broadly diversified share portfolio. The Fund is ‘internally’ geared meaning all gearing obligations are met by the Fund.
The Fund’s gearing ratio (the total amount borrowed expressed as a percentage of the total assets of the Fund) is managed between 50-65% and rebalanced to the mid-point when these levels are reached.
Example:
GEAR has a total asset value of $100,000 where borrowed funds make up $57,500. This then has a gearing ratio of 57.50% (right at the mid-point of the target ratio).
Fund Value Increases – If the value of the fund increases by 16%. This means the total value is now $116,000 with borrowed funds now representing 49.5%. Given this is outside the target range, the Fund then needs to borrow more and buy additional fund assets to return back to the mid-point. To meet the geared ratio of 57.5%, the Fund needs to increase the borrowed funds up to $66,700.
Fund Value Decreases – If the value of the fund decreases by 15%. This means the total value is now $85,000 with borrowed funds now representing 67.6%. Again, this is outside the target range, the Fund will need to sell down assets to get the borrowed fund down to the mid-point level. Our initial asset level was $42,500, but this needs to be sold down and reduced to $36,125. Borrowed funds required to be reduced to down to $48,875 to meet the mid-point requirement.
The Two Types of Leveraged ETFs
As stated above, Leveraged ETFs either use derivatives or gearing as leverage. When derivatives like CFDs are used to obtain this leverage, these funds are rebalanced daily. This is the most common type of leveraged ETF.
Since I will be talking about GEAR, I will not bother too much with “Derivative ETFs”.
The other type of leveraged ETF is when the leverage is used by borrowing money (i.e., gearing). This allows rebalancing to occur much less frequently, as it only occurs when the pre-determined limits have been exceeded (as stated above, for GEAR they are 50% and 65%).
There are two critical factors when assessing leveraged ETFs for long-term investing. Leverage resetting (or rebalancing) process, and slippage. I talked above about how to rebalancing process works for a product like GEAR.
What is slippage?
Slippage is the deviation from the initial benchmark from days of equal growth and loss. Simply put, if I start with $100, and Day 1 has growth of 10%, I now have $110. Day 2 has a drop of 10%, I now have $99. That $1 is the slippage.
With leveraged funds, it is magnified and becomes more significant. Let’s use an example where we have 2x leverage for our fund.
Start with $100 and Day 1 growth is 10% (but now +20% due to leverage) so our value is $120. Day 2 we have a loss of 10% (but now -20%) so our final value is $96. Now our slippage is $4.
Unfortunately, quadratics in this instance is not our friend.
This can cause dramatic ramifications on our portfolio if the ETF is rebalanced daily, so for the purposes of long-term investing, I am willing to rule out every Leveraged ETF that rebalances daily.
Slippage Example in Long Term
To further illustrate how slippage can look over the long term. I want to picture the following scenario:
An ETF has a continuous cycle of -2% one day followed by +2.1%, repeated over and over. With an unleveraged ETF our overall price would look like this:
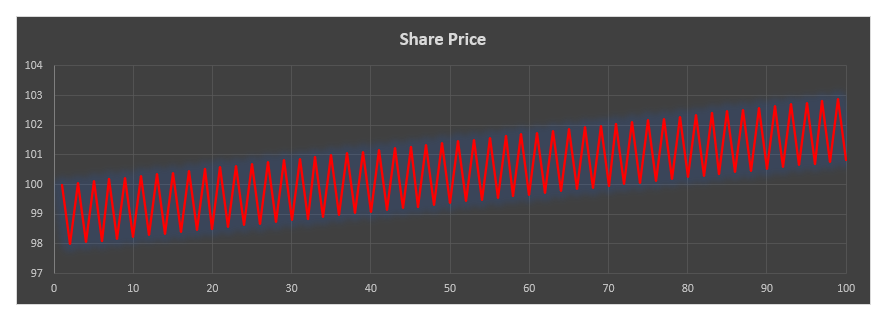
As you can see there is an overall trend in the upward direction which is what we would want to see if we were investing for the long term.
But what about if we were in a leveraged ETF where the gains/losses were magnified 3x, so now we would lose 6.0% and gain 6.3% the subsequent day. Our results would now look like this:
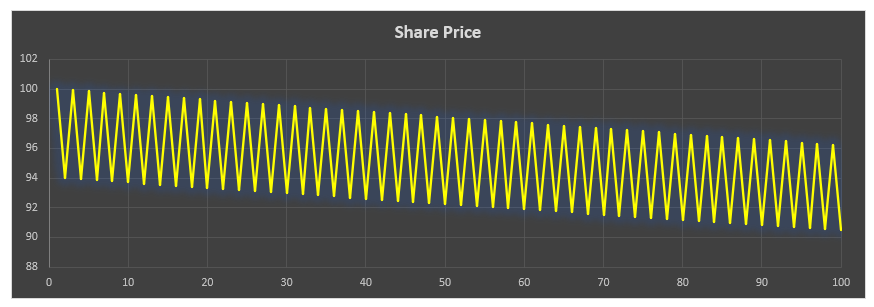
Due to slippage and leveraging, we now have an ETF in a downward trend, even though the underlying ETF is actually in an upward trend.
How often does GEAR rebalance?
Due to several reasons, the less rebalancing that is required, the better it appears for the portfolio to operate over time. If you need to rebalance because the price is increasing, then you are buying more shares at higher and higher prices, this is alright if the prices do continue to rise, but you need to be wary at buying at a peak and being forced to sell at a trough.
Unfortunately, with rebalancing, if the gearing ratio is too high (i.e., a falling market) then you are forced to sell assets at a lower price. The loss you had on paper has now been locked in and becomes real.
So, the question is, how often does this actually happen? Well, it is difficult to find data unfortunately, but since inception of the ETF (30/4/2014) the fund has had to rebalance 5 times up to 2020 (18/1/2016, 21/7/2016, 29/8/18, 20/12/18 and 24/4/2019). I cannot find out what happened in 2020, but given the sudden rise, fall and rise again around Covid, I imagine it probably rebalanced an additional 3 times. That would be 8 rebalances over 7 years of operating.
How does GEAR perform?
Below is a chart of the returns of GEAR since inception with the baseline ASX200 shown as XJO.
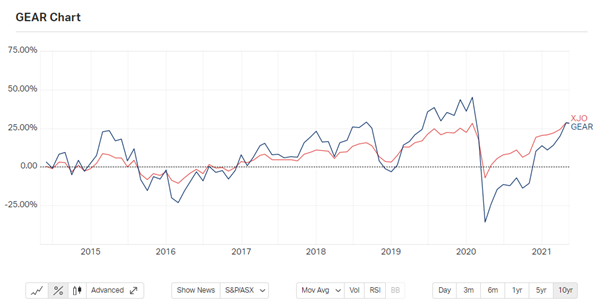
As you can see in the above chart, as it should do, it increases the volatility of ASX200 over time, the gains are greater, but the falls are deeper as well. Since inception, it has an overall return of approximately 29.00%, quite similar to the ASX200 index.
Next step, I wanted to actually look at the number of days GEAR is above the baseline index (ASX200) compared to how many days it sits below.
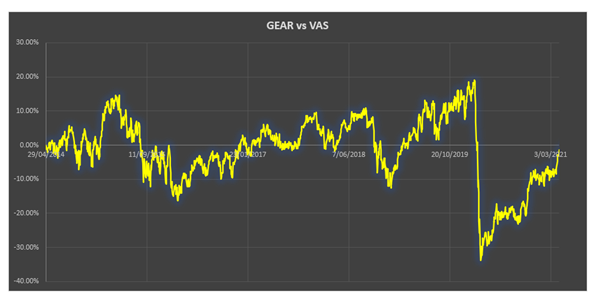
Above is a chart showing the difference in growth of GEAR vs VAS (VAS should be similar enough to the ASX200 to provide the same baseline).
The number of days that GEAR provides a better return than VAS over this period was 877 days.
The number of days that GEAR provides a lower return than VAS over this period was 908 days.
So less than half the time it was able to actually provide a better return compared to just investing on the baseline ETF. All of this with the additional volatility.
Finally, I want to have a look at the recovery duration between GEAR and A200 since the COVID crash in March/April 2020. The graph below details the share price over time (in relation to the price on 3/2/2020).
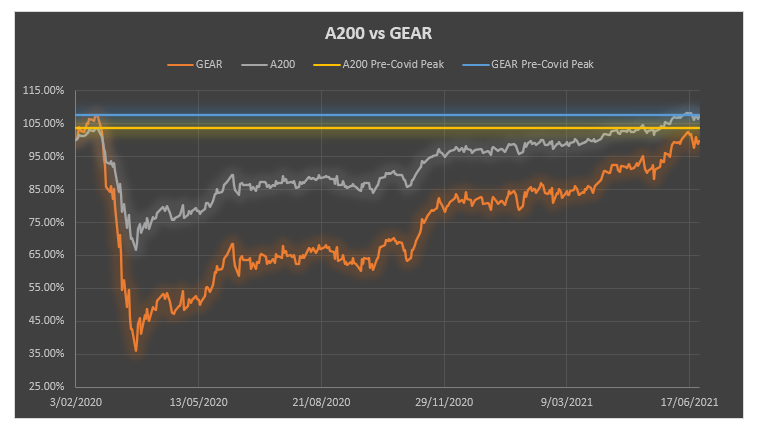
A200 and GEAR both peaked on 20/2/2020 prior to the Covid crash, their respective price was 103.64% and 107.78% (compared to their respective price on 3/2/2020).
A200 was able to fully recover back to it’s pre-covid price by 10/5/2021. At this stage, GEAR was still only 88% of it’s pre-Covid peak price. It is still yet to fully recover to get back to the original price it was prior to the Covid crash.
This is another reason why I would be more reluctant to invest in leveraged ETFs.
Overall
There is a lot more research that I will need to do on leveraged funds before I could really make an informed opinion on the subject. At the moment however, with the limited knowledge I do have, I really cannot see the justification to include these within my portfolio. The increased volatility is not something that I am really prepared to take on, especially given the performance does not look significantly better than other ETFs.
Currently, on Betashares website the performance of the fund since inception has provided 9.08% per annum (after fees) compared with the index fund performance of 7.95% per annum over the same time period. While it is showing slightly better returns, overall, I am not willing to accept the increased volatility and risk that comes with it, to add it to my portfolio.